 TensorFlow.org で表示 TensorFlow.org で表示 |
 Google Colab で実行 Google Colab で実行 |
 GitHub でソースを表示 GitHub でソースを表示 |
 ノートブックをダウンロード ノートブックをダウンロード |
このチュートリアルでは、tf.keras.Sequential モデルを使用して花の画像を分類し、tf.keras.utils.image_dataset_from_directory を使用してデータを読み込む方法を示します。このチュートリアルでは、次の概念を実際に見ていきます。
- ディスク上のデータセットを効率的に読み込みます。
- 過学習を識別し、データ拡張やドロップアウトなどテクニックを使用して過学習を防ぎます。
このチュートリアルは、基本的な機械学習のワークフローに従います。
- データの調査及び理解
- 入力パイプラインの構築
- モデルの構築
- モデルの学習
- モデルのテスト
- モデルの改善とプロセスの繰り返し
さらに、このノートブックは、保存されたモデルを、モバイルデバイス、組み込みデバイス、IoT デバイスでのオンデバイス機械学習用の TensorFlow Lite モデルに変換する方法を実演します。
セットアップ
TensorFlow とその他の必要なライブラリをインポートします。
import matplotlib.pyplot as plt
import numpy as np
import PIL
import tensorflow as tf

from tensorflow import keras
from tensorflow.keras import layers
from tensorflow.keras.models import Sequential
2024-01-11 22:28:47.421235: E external/local_xla/xla/stream_executor/cuda/cuda_dnn.cc:9261] Unable to register cuDNN factory: Attempting to register factory for plugin cuDNN when one has already been registered
2024-01-11 22:28:47.421277: E external/local_xla/xla/stream_executor/cuda/cuda_fft.cc:607] Unable to register cuFFT factory: Attempting to register factory for plugin cuFFT when one has already been registered
2024-01-11 22:28:47.422793: E external/local_xla/xla/stream_executor/cuda/cuda_blas.cc:1515] Unable to register cuBLAS factory: Attempting to register factory for plugin cuBLAS when one has already been registered
データセットをダウンロードして調査する
このチュートリアルでは、約3,700枚の花の写真のデータセットを使用します。データセットには、クラスごとに1つずつ、5 つのサブディレクトリが含まれています。
flower_photo/
  daisy/
  dandelion/
  roses/
  sunflowers/
  tulips/
import pathlib

dataset_url = "https://storage.googleapis.com/download.tensorflow.org/example_images/flower_photos.tgz"
data_dir = tf.keras.utils.get_file('flower_photos.tar', origin=dataset_url, extract=True)
data_dir = pathlib.Path(data_dir).with_suffix('')
Downloading data from https://storage.googleapis.com/download.tensorflow.org/example_images/flower_photos.tgz
228813984/228813984 [==============================] - 1s 0us/step
ダウンロード後、データセットのコピーが利用できるようになります。合計3,670枚の画像があります。
image_count = len(list(data_dir.glob('*/*.jpg')))
print(image_count)
3670
バラの画像です。
roses = list(data_dir.glob('roses/*'))
PIL.Image.open(str(roses[0]))

PIL.Image.open(str(roses[1]))

チューリップの画像です。
tulips = list(data_dir.glob('tulips/*'))
PIL.Image.open(str(tulips[0]))

PIL.Image.open(str(tulips[1]))

Keras ユーティリティを使用してデータを読み込む
次に、便利な image_dataset_from_directory ユーティリティを使用して、これらの画像をディスクから読み込みます。これにより、数行のコードでディスク上の画像のディレクトリから tf.data.Datasetに移動します。また、画像を読み込んで前処理するチュートリアルにアクセスして、独自のデータ読み込みコードを最初から作成することもできます。
データセットを作成する
ローダーのいくつかのパラメーターを定義します。
batch_size = 32
img_height = 180
img_width = 180
モデルを開発するときは、検証分割を使用することをお勧めします。ここでは、画像の 80% をトレーニングに使用し、20% を検証に使用します。
train_ds = tf.keras.utils.image_dataset_from_directory(
  data_dir,
  validation_split=0.2,
  subset="training",
  seed=123,
  image_size=(img_height, img_width),
  batch_size=batch_size)
Found 3670 files belonging to 5 classes.
Using 2936 files for training.
val_ds = tf.keras.utils.image_dataset_from_directory(
  data_dir,
  validation_split=0.2,
  subset="validation",
  seed=123,
  image_size=(img_height, img_width),
  batch_size=batch_size)
Found 3670 files belonging to 5 classes.
Using 734 files for validation.
クラス名は、これらのデータセットのclass_names属性にあります。 これらはアルファベット順にディレクトリ名に対応します。
class_names = train_ds.class_names
print(class_names)
['daisy', 'dandelion', 'roses', 'sunflowers', 'tulips']
データを視覚化する
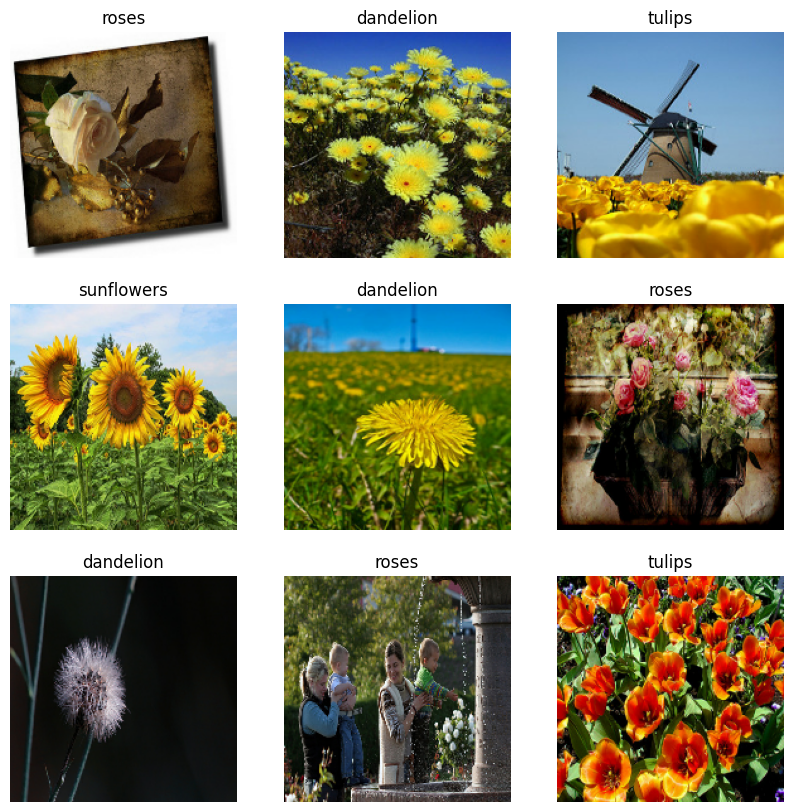
以下はトレーニングデータセットの最初の 9 枚の画像です。
import matplotlib.pyplot as plt

plt.figure(figsize=(10, 10))
for images, labels in train_ds.take(1):
  for i in range(9):
    ax = plt.subplot(3, 3, i + 1)
    plt.imshow(images[i].numpy().astype("uint8"))
    plt.title(class_names[labels[i]])
    plt.axis("off")

これらのデータセットを Keras Model.fit に渡すことで、モデルをトレーニングできます(このチュートリアルの後の方で説明しています)。また、手動でデータセットを反復し、画像のバッチを取得することもできます。
for image_batch, labels_batch in train_ds:
  print(image_batch.shape)
  print(labels_batch.shape)
  break
(32, 180, 180, 3)
(32,)
image_batchは、形状(32, 180, 180, 3)のテンソルです。これは、形状180x180x3の 32 枚の画像のバッチです(最後の次元はカラーチャンネル RGB を参照します)。label_batchは、形状(32,)のテンソルであり、これらは 32 枚の画像に対応するラベルです。
image_batchおよびlabels_batchテンソルで.numpy()を呼び出して、それらをnumpy.ndarrayに変換できます。
データセットを構成してパフォーマンスを改善する
I/O がブロックされることなくディスクからデータを取得できるように、必ずバッファ付きプリフェッチを使用します。これらは、データを読み込むときに使用する必要がある 2 つの重要な方法です。
Dataset.cache()は、最初のエポック中に画像をディスクから読み込んだ後、メモリに保持します。これにより、モデルのトレーニング中にデータセットがボトルネックになることを回避できます。データセットが大きすぎてメモリに収まらない場合は、この方法を使用して、パフォーマンスの高いオンディスクキャッシュを作成することもできます。Dataset.prefetchはトレーニング中にデータの前処理とモデルの実行をオーバーラップさせます。
以上の 2 つの方法とデータをディスクにキャッシュする方法についての詳細は、データパフォーマンスガイドの プリフェッチを参照してください。
AUTOTUNE = tf.data.AUTOTUNE

train_ds = train_ds.cache().shuffle(1000).prefetch(buffer_size=AUTOTUNE)
val_ds = val_ds.cache().prefetch(buffer_size=AUTOTUNE)
データを標準化する
RGB チャネル値は [0, 255] の範囲にあり、ニューラルネットワークには理想的ではありません。一般に、入力値は小さくする必要があります。
ここでは、tf.keras.layers.Rescaling を使用して、値を [0, 1] の範囲に標準化します。
normalization_layer = layers.Rescaling(1./255)
このレイヤーを使用するには 2 つの方法があります。Dataset.map を呼び出すことにより、データセットに適用できます。
normalized_ds = train_ds.map(lambda x, y: (normalization_layer(x), y))
image_batch, labels_batch = next(iter(normalized_ds))
first_image = image_batch[0]
# Notice the pixel values are now in `[0,1]`.
print(np.min(first_image), np.max(first_image))
0.0 1.0
または、モデル定義内にレイヤーを含めることができます。これにより、デプロイメントを簡素化できます。 ここでは 2 番目のアプローチを使用します。
注意: 以前は、tf.keras.utils.image_dataset_from_directory の image_size 引数を使用して画像のサイズを変更しました。モデルにサイズ変更ロジックも含める場合は、tf.keras.layers.Resizing レイヤーを使用できます。
基本的な Keras モデル
モデルを作成する
Sequential モデルは、それぞれに最大プールレイヤー (tf.keras.layers.MaxPooling2D)を持つ 3 つの畳み込みブロック(tf.keras.layers.Conv2D)で構成されます。ReLU 活性化関数('relu')により活性化されたユニットが 128 個ある完全に接続されたレイヤー (tf.keras.layers.Dense)があります。このチュートリアルの目的は、標準的なアプローチを示すことなので、このモデルは高精度に調整されていません。
num_classes = len(class_names)

model = Sequential([
  layers.Rescaling(1./255, input_shape=(img_height, img_width, 3)),
  layers.Conv2D(16, 3, padding='same', activation='relu'),
  layers.MaxPooling2D(),
  layers.Conv2D(32, 3, padding='same', activation='relu'),
  layers.MaxPooling2D(),
  layers.Conv2D(64, 3, padding='same', activation='relu'),
  layers.MaxPooling2D(),
  layers.Flatten(),
  layers.Dense(128, activation='relu'),
  layers.Dense(num_classes)
])
モデルをコンパイルする
このチュートリアルでは、tf.keras.optimizers.Adam オプティマイザとtf.keras.losses.SparseCategoricalCrossentropy 損失関数を選択します。各トレーニングエポックのトレーニングと検証の精度を表示するには、Model.compile に metrics 引数を渡します。
model.compile(optimizer='adam',
              loss=tf.keras.losses.SparseCategoricalCrossentropy(from_logits=True),
              metrics=['accuracy'])
モデルの概要
Keras の Model.summary メソッドを使用して、ネットワークのすべてのレイヤーを表示します。
model.summary()
Model: "sequential"
_________________________________________________________________
 Layer (type)                Output Shape              Param #
=================================================================
 rescaling_1 (Rescaling)     (None, 180, 180, 3)       0

 conv2d (Conv2D)             (None, 180, 180, 16)      448

 max_pooling2d (MaxPooling2  (None, 90, 90, 16)        0
 D)

 conv2d_1 (Conv2D)           (None, 90, 90, 32)        4640

 max_pooling2d_1 (MaxPoolin  (None, 45, 45, 32)        0
 g2D)

 conv2d_2 (Conv2D)           (None, 45, 45, 64)        18496

 max_pooling2d_2 (MaxPoolin  (None, 22, 22, 64)        0
 g2D)

 flatten (Flatten)           (None, 30976)             0

 dense (Dense)               (None, 128)               3965056

 dense_1 (Dense)             (None, 5)                 645

=================================================================
Total params: 3989285 (15.22 MB)
Trainable params: 3989285 (15.22 MB)
Non-trainable params: 0 (0.00 Byte)
_________________________________________________________________
モデルをトレーニングする
Keras Model.fit メソッドを使用して、10 エポックのモデルをトレーニングします。
epochs=10
history = model.fit(
  train_ds,
  validation_data=val_ds,
  epochs=epochs
)
Epoch 1/10
WARNING: All log messages before absl::InitializeLog() is called are written to STDERR
I0000 00:00:1705012140.129092 1029321 device_compiler.h:186] Compiled cluster using XLA!  This line is logged at most once for the lifetime of the process.
92/92 [==============================] - 7s 35ms/step - loss: 1.3368 - accuracy: 0.4268 - val_loss: 1.1183 - val_accuracy: 0.5422
Epoch 2/10
92/92 [==============================] - 2s 21ms/step - loss: 0.9825 - accuracy: 0.6250 - val_loss: 0.9808 - val_accuracy: 0.6076
Epoch 3/10
92/92 [==============================] - 2s 21ms/step - loss: 0.7777 - accuracy: 0.7044 - val_loss: 0.9365 - val_accuracy: 0.6580
Epoch 4/10
92/92 [==============================] - 2s 21ms/step - loss: 0.5722 - accuracy: 0.7916 - val_loss: 0.9991 - val_accuracy: 0.6417
Epoch 5/10
92/92 [==============================] - 2s 21ms/step - loss: 0.3731 - accuracy: 0.8678 - val_loss: 1.1610 - val_accuracy: 0.6458
Epoch 6/10
92/92 [==============================] - 2s 21ms/step - loss: 0.2418 - accuracy: 0.9189 - val_loss: 1.2701 - val_accuracy: 0.6390
Epoch 7/10
92/92 [==============================] - 2s 21ms/step - loss: 0.1274 - accuracy: 0.9656 - val_loss: 1.4740 - val_accuracy: 0.6376
Epoch 8/10
92/92 [==============================] - 2s 21ms/step - loss: 0.0956 - accuracy: 0.9728 - val_loss: 1.5336 - val_accuracy: 0.6362
Epoch 9/10
92/92 [==============================] - 2s 21ms/step - loss: 0.0613 - accuracy: 0.9833 - val_loss: 1.9099 - val_accuracy: 0.6022
Epoch 10/10
92/92 [==============================] - 2s 21ms/step - loss: 0.0219 - accuracy: 0.9952 - val_loss: 2.1516 - val_accuracy: 0.6240
トレーニングの結果を視覚化する
トレーニングセットと検証セットで損失と精度のプロットを作成します。
acc = history.history['accuracy']
val_acc = history.history['val_accuracy']

loss = history.history['loss']
val_loss = history.history['val_loss']

epochs_range = range(epochs)

plt.figure(figsize=(8, 8))
plt.subplot(1, 2, 1)
plt.plot(epochs_range, acc, label='Training Accuracy')
plt.plot(epochs_range, val_acc, label='Validation Accuracy')
plt.legend(loc='lower right')
plt.title('Training and Validation Accuracy')

plt.subplot(1, 2, 2)
plt.plot(epochs_range, loss, label='Training Loss')
plt.plot(epochs_range, val_loss, label='Validation Loss')
plt.legend(loc='upper right')
plt.title('Training and Validation Loss')
plt.show()

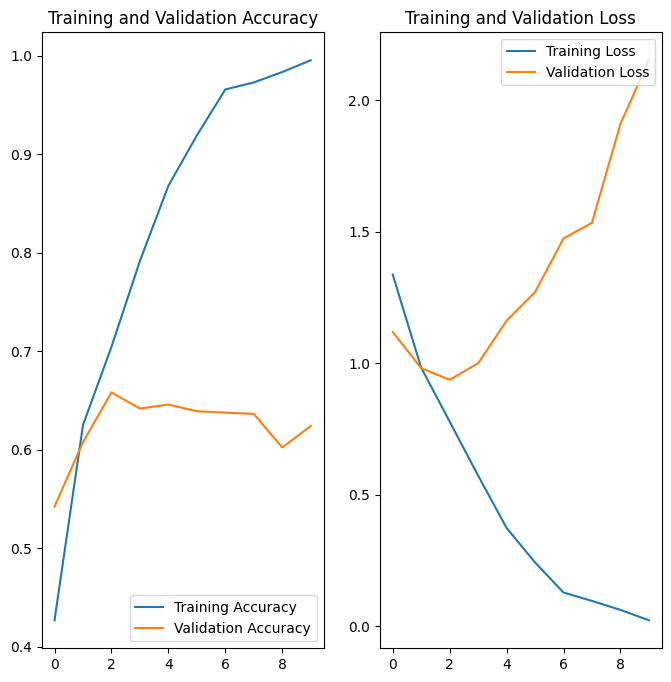
プロットには、トレーニングの精度と検証の精度は大幅にずれており、モデルは検証セットで約 60% の精度しか達成していないことが示されています。
以下のチュートリアルセクションでは、問題の原因を調べ、モデルの全体的なパフォーマンスを向上させる方法を示します。
過学習
上記のプロットでは、トレーニングの精度は時間の経過とともに直線的に増加していますが、検証の精度はトレーニングプロセスで約60%のままです。また、トレーニングと検証の精度に大きな違いがあり、これは過学習の兆候を示しています。
トレーニングサンプルの数が少ない場合、モデルは、トレーニングサンプルのノイズや不要な詳細から学習し、新しいサンプルでのモデルのパフォーマンスに悪影響を及ぼすことがあります。 この現象は過学習として知られています。 これは、モデルが新しいデータセットで一般化する上で問題があることを意味します。
トレーニングプロセスで過学習を回避する方法は複数あります。このチュートリアルでは、データ拡張を使用して、モデルにドロップアウトを追加します。
データ拡張
過学習は、一般に、トレーニングサンプルの数が少ない場合に発生します。データ拡張は、既存のサンプルに対してランダムな変換を使用してサンプルを拡張することにより、追加のトレーニングデータを生成します。これにより、モデルをデータのより多くの側面でトレーニングし、より一般化することができます。
tf.keras.layers.RandomFlip、tf.keras.layers.RandomRotation、および tf.keras.layers.RandomZoom の前処理レイヤーを使用して、データ拡張を実装します。これらは、他のレイヤーと同様にモデル内に含めて、GPU で実行できます。
data_augmentation = keras.Sequential(
  [
    layers.RandomFlip("horizontal",
                      input_shape=(img_height,
                                  img_width,
                                  3)),
    layers.RandomRotation(0.1),
    layers.RandomZoom(0.1),
  ]
)
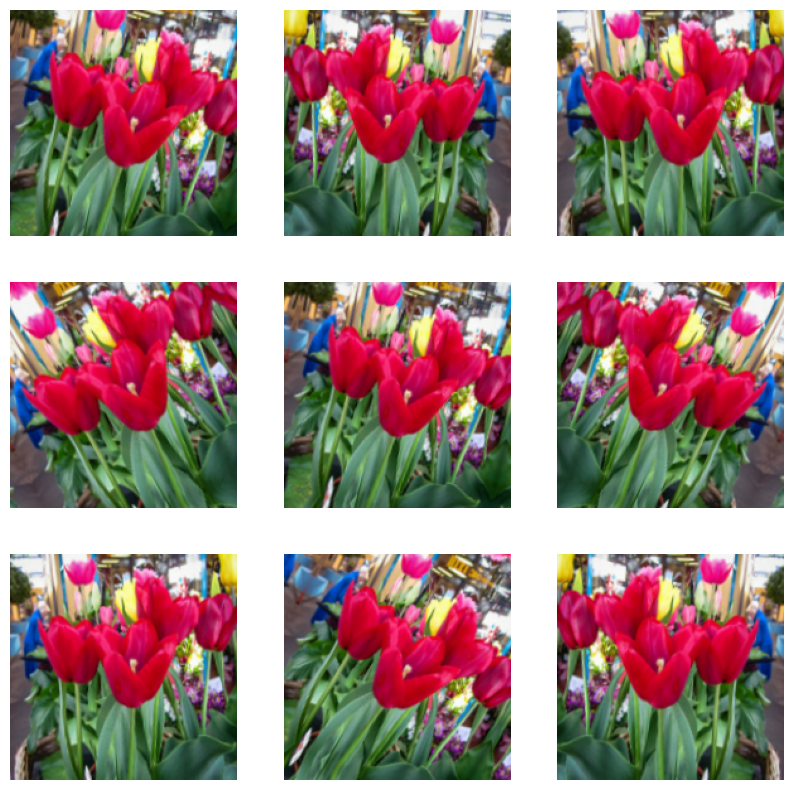
同じ画像にデータ拡張を数回適用して、いくつかの拡張されたデータがどのようになるかを視覚化してみましょう。
plt.figure(figsize=(10, 10))
for images, _ in train_ds.take(1):
  for i in range(9):
    augmented_images = data_augmentation(images)
    ax = plt.subplot(3, 3, i + 1)
    plt.imshow(augmented_images[0].numpy().astype("uint8"))
    plt.axis("off")

次のステップでトレーニングする前に、モデルにデータ拡張を追加します。
ドロップアウト
過学習を回避するもう 1 つの方法は、ドロップアウト 正則化をネットワークに導入することです。
ドロップアウトをレイヤーに適用すると、トレーニングプロセス中にレイヤーからいくつかの出力ユニットがランダムにドロップアウトされます(アクティベーションをゼロに設定することにより)。ドロップアウトは、0.1、0.2、0.4 などの形式で、入力値として小数を取ります。これは、適用されたレイヤーから出力ユニットの 10%、20%、または 40% をランダムにドロップアウトすることを意味します。
拡張された画像を使用してトレーニングする前に、tf.keras.layers.Dropout を使用して新しいニューラルネットワークを作成します。
model = Sequential([
  data_augmentation,
  layers.Rescaling(1./255),
  layers.Conv2D(16, 3, padding='same', activation='relu'),
  layers.MaxPooling2D(),
  layers.Conv2D(32, 3, padding='same', activation='relu'),
  layers.MaxPooling2D(),
  layers.Conv2D(64, 3, padding='same', activation='relu'),
  layers.MaxPooling2D(),
  layers.Dropout(0.2),
  layers.Flatten(),
  layers.Dense(128, activation='relu'),
  layers.Dense(num_classes, name="outputs")
])
モデルをコンパイルしてトレーニングする
model.compile(optimizer='adam',
              loss=tf.keras.losses.SparseCategoricalCrossentropy(from_logits=True),
              metrics=['accuracy'])
model.summary()
Model: "sequential_2"
_________________________________________________________________
 Layer (type)                Output Shape              Param #
=================================================================
 sequential_1 (Sequential)   (None, 180, 180, 3)       0

 rescaling_2 (Rescaling)     (None, 180, 180, 3)       0

 conv2d_3 (Conv2D)           (None, 180, 180, 16)      448

 max_pooling2d_3 (MaxPoolin  (None, 90, 90, 16)        0
 g2D)

 conv2d_4 (Conv2D)           (None, 90, 90, 32)        4640

 max_pooling2d_4 (MaxPoolin  (None, 45, 45, 32)        0
 g2D)

 conv2d_5 (Conv2D)           (None, 45, 45, 64)        18496

 max_pooling2d_5 (MaxPoolin  (None, 22, 22, 64)        0
 g2D)

 dropout (Dropout)           (None, 22, 22, 64)        0

 flatten_1 (Flatten)         (None, 30976)             0

 dense_2 (Dense)             (None, 128)               3965056

 outputs (Dense)             (None, 5)                 645

=================================================================
Total params: 3989285 (15.22 MB)
Trainable params: 3989285 (15.22 MB)
Non-trainable params: 0 (0.00 Byte)
_________________________________________________________________
epochs = 15
history = model.fit(
  train_ds,
  validation_data=val_ds,
  epochs=epochs
)
Epoch 1/15
2024-01-11 22:29:25.242708: E tensorflow/core/grappler/optimizers/meta_optimizer.cc:961] layout failed: INVALID_ARGUMENT: Size of values 0 does not match size of permutation 4 @ fanin shape insequential_2/dropout/dropout/SelectV2-2-TransposeNHWCToNCHW-LayoutOptimizer
92/92 [==============================] - 5s 30ms/step - loss: 1.2953 - accuracy: 0.4482 - val_loss: 1.0794 - val_accuracy: 0.5599
Epoch 2/15
92/92 [==============================] - 3s 28ms/step - loss: 1.0533 - accuracy: 0.5725 - val_loss: 1.0320 - val_accuracy: 0.5886
Epoch 3/15
92/92 [==============================] - 3s 28ms/step - loss: 0.9596 - accuracy: 0.6209 - val_loss: 1.1750 - val_accuracy: 0.5354
Epoch 4/15
92/92 [==============================] - 3s 28ms/step - loss: 0.8831 - accuracy: 0.6666 - val_loss: 0.9653 - val_accuracy: 0.6199
Epoch 5/15
92/92 [==============================] - 3s 28ms/step - loss: 0.7959 - accuracy: 0.6941 - val_loss: 0.8394 - val_accuracy: 0.6662
Epoch 6/15
92/92 [==============================] - 3s 28ms/step - loss: 0.7456 - accuracy: 0.7139 - val_loss: 0.7961 - val_accuracy: 0.6785
Epoch 7/15
92/92 [==============================] - 3s 28ms/step - loss: 0.7215 - accuracy: 0.7282 - val_loss: 0.7351 - val_accuracy: 0.7125
Epoch 8/15
92/92 [==============================] - 3s 28ms/step - loss: 0.6774 - accuracy: 0.7503 - val_loss: 0.7764 - val_accuracy: 0.7112
Epoch 9/15
92/92 [==============================] - 3s 28ms/step - loss: 0.6521 - accuracy: 0.7497 - val_loss: 0.7691 - val_accuracy: 0.7016
Epoch 10/15
92/92 [==============================] - 3s 28ms/step - loss: 0.6263 - accuracy: 0.7589 - val_loss: 0.7217 - val_accuracy: 0.7207
Epoch 11/15
92/92 [==============================] - 3s 28ms/step - loss: 0.5988 - accuracy: 0.7667 - val_loss: 0.7587 - val_accuracy: 0.7193
Epoch 12/15
92/92 [==============================] - 3s 28ms/step - loss: 0.5809 - accuracy: 0.7755 - val_loss: 0.6886 - val_accuracy: 0.7466
Epoch 13/15
92/92 [==============================] - 3s 28ms/step - loss: 0.5736 - accuracy: 0.7875 - val_loss: 0.7498 - val_accuracy: 0.7016
Epoch 14/15
92/92 [==============================] - 3s 28ms/step - loss: 0.5288 - accuracy: 0.7946 - val_loss: 0.7045 - val_accuracy: 0.7384
Epoch 15/15
92/92 [==============================] - 3s 28ms/step - loss: 0.5288 - accuracy: 0.7922 - val_loss: 0.7115 - val_accuracy: 0.7330
トレーニングの結果を視覚化する
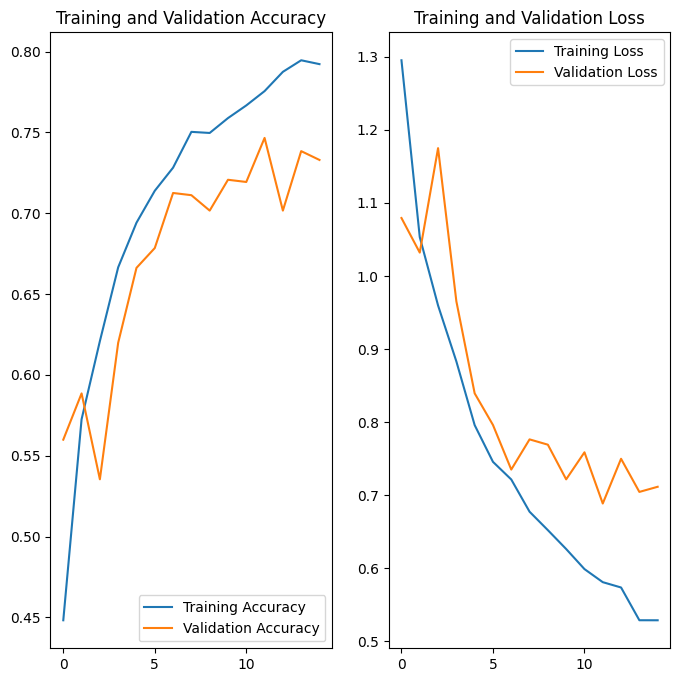
データ拡張と tf.keras.layers.Dropout を適用した後は、以前よりも過学習が少なくなり、トレーニングと検証がより高精度に調整されます。
acc = history.history['accuracy']
val_acc = history.history['val_accuracy']

loss = history.history['loss']
val_loss = history.history['val_loss']

epochs_range = range(epochs)

plt.figure(figsize=(8, 8))
plt.subplot(1, 2, 1)
plt.plot(epochs_range, acc, label='Training Accuracy')
plt.plot(epochs_range, val_acc, label='Validation Accuracy')
plt.legend(loc='lower right')
plt.title('Training and Validation Accuracy')

plt.subplot(1, 2, 2)
plt.plot(epochs_range, loss, label='Training Loss')
plt.plot(epochs_range, val_loss, label='Validation Loss')
plt.legend(loc='upper right')
plt.title('Training and Validation Loss')
plt.show()

新しいデータを予測する
モデルを使用して、トレーニングセットまたは検証セットに含まれていなかった画像を分類します。
注意: データ拡張レイヤーとドロップアウトレイヤーは、推論時に非アクティブになります。
sunflower_url = "https://storage.googleapis.com/download.tensorflow.org/example_images/592px-Red_sunflower.jpg"
sunflower_path = tf.keras.utils.get_file('Red_sunflower', origin=sunflower_url)

img = tf.keras.utils.load_img(
    sunflower_path, target_size=(img_height, img_width)
)
img_array = tf.keras.utils.img_to_array(img)
img_array = tf.expand_dims(img_array, 0) # Create a batch

predictions = model.predict(img_array)
score = tf.nn.softmax(predictions[0])

print(
    "This image most likely belongs to {} with a {:.2f} percent confidence."
    .format(class_names[np.argmax(score)], 100 * np.max(score))
)
Downloading data from https://storage.googleapis.com/download.tensorflow.org/example_images/592px-Red_sunflower.jpg
117948/117948 [==============================] - 0s 0us/step
1/1 [==============================] - 0s 270ms/step
This image most likely belongs to sunflowers with a 98.38 percent confidence.
TensorFlow Lite を使用する
TensorFlow Lite は、オンデバイスの機械学習を可能にする一連のツールで、開発者がモバイルデバイス、組み込みデバイス、エッジデバイスでモデルを実行できるようにします。
Keras Sequential モデルを TensorFlow Lite モデルに変換する
トレーニング済みのモデルをオンデバイスのアプリケーションで使用するには、まず TensorFlow Lite モデルと呼ばれる、より小さく効率的なモデル形式に変換します。
この例では、トレーニング済みの Keras Sequential モデルを取得し、tf.lite.TFLiteConverter.from_keras_model を使用して TensorFlow Lite モデルを生成します。
# Convert the model.
converter = tf.lite.TFLiteConverter.from_keras_model(model)
tflite_model = converter.convert()

# Save the model.
with open('model.tflite', 'wb') as f:
  f.write(tflite_model)
INFO:tensorflow:Assets written to: /tmpfs/tmp/tmpgfjhdzpd/assets
INFO:tensorflow:Assets written to: /tmpfs/tmp/tmpgfjhdzpd/assets
2024-01-11 22:30:08.730272: W tensorflow/compiler/mlir/lite/python/tf_tfl_flatbuffer_helpers.cc:378] Ignored output_format.
2024-01-11 22:30:08.730316: W tensorflow/compiler/mlir/lite/python/tf_tfl_flatbuffer_helpers.cc:381] Ignored drop_control_dependency.
Summary on the non-converted ops:
---------------------------------

 * Accepted dialects: tfl, builtin, func
 * Non-Converted Ops: 11, Total Ops 23, % non-converted = 47.83 %
 * 11 ARITH ops

- arith.constant:   11 occurrences  (f32: 10, i32: 1)


  (f32: 3)
  (f32: 2)
  (f32: 3)
  (f32: 1)
前のステップで保存した TensorFlow Lite モデルには、複数の関数シグネチャを含めることができます。Keras モデルコンバーター API は、デフォルトのシグネチャを自動的に使用します。詳細は TensorFlow Lite シグネチャを参照してください。
TensorFlow Lite モデルを実行する
tf.lite.Interpreter クラスを介して、Python で TensorFlow Lite の保存されたモデルシグネチャにアクセスできます。
Interpreter を使用してモデルを読み込みます。
TF_MODEL_FILE_PATH = 'model.tflite' # The default path to the saved TensorFlow Lite model

interpreter = tf.lite.Interpreter(model_path=TF_MODEL_FILE_PATH)
変換されたモデルからシグネチャを出力して、入力 (および出力) の名前を取得します。
interpreter.get_signature_list()
{'serving_default': {'inputs': ['sequential_1_input'], 'outputs': ['outputs']} }
この例では、serving_default という名前のデフォルトシグネチャが 1 つあります。さらに、'inputs' の名前は 'sequential_1_input' であり、'outputs' の名前は 'outputs' です。このチュートリアルで前に示したように、Model.summary を実行すると、これらの最初と最後の Keras レイヤー名を検索できます。
次のようにシグネチャ名を渡すことで、tf.lite.Interpreter.get_signature_runner を使用してサンプル画像で推論を実行し、読み込まれた TensorFlow モデルをテストできます。
classify_lite = interpreter.get_signature_runner('serving_default')
classify_lite
<tensorflow.lite.python.interpreter.SignatureRunner at 0x7f16e4168940>
チュートリアルの前半で行ったように、TensorFlow Lite モデルを使用して、トレーニングセットまたは検証セットに含まれていない画像を分類できます。
画像は既にテンソル化され、img_array として保存されています。次に、読み込まれた TensorFlow Lite モデル (predictions_lite)の最初の引数 ('inputs' の名前)に渡し、ソフトマックス活性化を計算し、計算された確率が最も高いクラスの予測を出力します。
predictions_lite = classify_lite(sequential_1_input=img_array)['outputs']
score_lite = tf.nn.softmax(predictions_lite)
print(
    "This image most likely belongs to {} with a {:.2f} percent confidence."
    .format(class_names[np.argmax(score_lite)], 100 * np.max(score_lite))
)
This image most likely belongs to sunflowers with a 98.38 percent confidence.
Lite モデルが生成した予測は、元のモデルが生成した予測とほぼ同一になります。
print(np.max(np.abs(predictions - predictions_lite)))
1.1920929e-06
モデルは画像が 5 つのクラス、'daisy'、'dandelion'、'roses'、'sunflowers'、および 'tulips' のうちヒマワリに属すると予測する必要があります。これは TensorFlow Lite 変換前と同じ結果です。
次のステップ
このチュートリアルでは、画像分類用のモデルをトレーニングしてテストし、オンデバイスのアプリケーション(画像分類アプリケーションなど)用の TensorFlow Lite 形式に変換し、Python API を使用して TensorFlow Lite モデルで推論を実行する方法を示しました。
