 TensorFlow.org에서 보기 TensorFlow.org에서 보기 |  Google Colab에서 실행 Google Colab에서 실행 |  GitHub에서 소스 보기 GitHub에서 소스 보기 |  노트북 다운로드 노트북 다운로드 |
Variational Inference(VI)는 근사 베이지안 추론을 최적화 문제로 던지고 실제 사후와의 KL 발산을 최소화하는 '대리' 사후 분포를 찾습니다. 그라디언트 기반 VI는 종종 MCMC 방법보다 빠르고, 모델 매개변수의 최적화로 자연스럽게 구성되며, 모델 비교, 수렴 진단 및 구성 가능한 추론에 직접 사용할 수 있는 모델 증거에 대한 하한을 제공합니다.
TensorFlow Probability는 TFP 스택에 자연스럽게 맞는 빠르고 유연하며 확장 가능한 VI를 위한 도구를 제공합니다. 이러한 도구를 사용하면 선형 변환 또는 흐름 정규화에 의해 유도된 공분산 구조를 사용하여 대리 사후 구조를 구성할 수 있습니다.
VI는 베이지안 추정하는 데 사용할 수있는 신뢰할 수있는 간격을 관심의 결과에 대한 다양한 치료 또는 관찰 된 기능의 효과를 추정하는 회귀 모형의 매개 변수. 신뢰할 수 있는 구간은 관찰된 데이터를 조건으로 하는 매개변수의 사후 분포에 따라 관찰되지 않은 매개변수의 값을 특정 확률로 제한하고 매개변수의 사전 분포에 대한 가정을 제공합니다.
(사용이 Colab에서, 우리는 가정에서 측정 된 라돈 수준 회귀 모델 선형 베이지안의 매개 변수에 대한 신뢰할 수있는 간격을 얻기 위해 VI를 사용하는 방법을 보여줍니다 .의 (2007) 라돈 데이터 세트 겔만 등을 ; 참조 유사한 예를 스탠). 우리는 TFP 방법을 보여 JointDistribution 들과 결합 bijectors 빌드 및 표현 대리의 포스 테리어의 두 가지 유형에 맞게 :
- 블록 행렬로 변환된 표준 정규 분포. 행렬은 사후 평균 또는 전체 공분산 사후의 가정을 완화하여 사후 구성 요소 간의 독립성과 다른 구성 요소 간의 종속성을 반영할 수 있습니다.
- 더 복잡한 고용량 회귀 흐름 역 .
대리 사후 데이터는 훈련되고 평균 필드 대리 사후 기준선의 결과 및 Hamiltonian Monte Carlo의 실제 샘플과 비교됩니다.
베이지안 변이 추론 개요
우리는 다음과 생식 과정 있다고 가정 \(\theta\) 임의의 매개 변수를 나타냅니다 \(\omega\) 결정적 매개 변수를 나타냅니다를하고 \(x_i\) 특징이며, \(y_i\) 에 대한 목표 값입니다 \(i=1,\ldots,n\) 데이터 포인트를 관찰 : \ {정렬을 시작 } &\theta \sim r(\Theta) && \text{(이전)}\ &\text{for } i = 1 \ldots n: \nonumber \ &\quad y_i \sim p(Y_i|x_i, \theta \ 오메가) && \ {텍스트 (우도)} \ {단부 정렬}
VI는 다음으로 특성화됩니다. $\newcommand{\E}{\operatorname{\mathbb{E} } } \newcommand{\K}{\operatorname{\mathbb{K} } } \newcommand{\defeq}{\overset {\tiny\text{def} }{=} } \DeclareMathOperator*{\argmin}{arg\,min}$
\ 로그 P ({y_i} _i ^ N | {x_i로부터} _i ^ N \ 오메가) - {정렬} 시작 \ & \ defeq - \ 기록 \ INT \ textrm {D} \ 세타 \ R을 (\ 세타) \ prod_i^np(y_i|x_i,\theta, \omega) && \text{(정말 단단한 적분)} \ &= -\log \int \textrm{d}\theta\, q(\theta) \frac{1 }{q(\theta)} r(\theta) \prod_i^np(y_i|x_i,\theta, \omega) && \text{(곱하기 1)}\ &\le - \int \textrm{d} \ 세타 \ Q (\ 세타) \ 기록 \ FRAC {R (\ 세타) \ prod_i ^ NP (y_i | X I \ 세타 \ 오메가)} {Q (\ 세타)} && \ 텍스트 {(옌센 부등식 )} \ & \ defeq \ E {Q (\ 쎄타)} - \ 로그 P (y_i | x_i로부터 \ 세타 \ 오메가)] + \ K [Q (\ 세타), R (\ 쎄타)] \ & \ defeq \text{expected negative log likelihood"} + \ 텍스트 {KL regularizer"} \ 끝 {정렬}
(기술적으로 우리가 가정하고 \(q\) 있다 절대적으로 연속 에 대한 \(r\).보기, 젠슨의 불평등 .)
경계는 모든 q에 대해 유지되기 때문에 분명히 다음과 같은 경우에 가장 엄격합니다.
\[q^*,w^* = \argmin_{q \in \mathcal{Q},\omega\in\mathbb{R}^d} \left\{ \sum_i^n\E_{q(\Theta)}\left[ -\log p(y_i|x_i,\Theta, \omega) \right] + \K[q(\Theta), r(\Theta)] \right\}\]
용어와 관련하여 우리는
- \(q^*\) 은 "대리 뒤,"와,
- \(\mathcal{Q}\) 은 "대리 가족."
\(\omega^*\) VI가 감소에 결정적 매개 변수의 최대 우도 값을 나타낸다. 참조 이 설문 조사 변분 추론에 대한 자세한 내용입니다.
예: 라돈 측정에 대한 베이지안 계층적 선형 회귀
라돈은 지면과의 접촉점을 통해 가정으로 유입되는 방사성 가스입니다. 비흡연자에서 폐암의 주요 원인이 되는 발암물질입니다. 라돈 수치는 가정마다 크게 다릅니다.
EPA는 80,000가구에서 라돈 수준에 대한 연구를 수행했습니다. 두 가지 중요한 예측 변수는 다음과 같습니다.
- 측정이 이루어진 층(지하실에서 더 높은 라돈)
- 카운티 우라늄 수준(라돈 수준과 양의 상관관계)
카운티별로 그룹화 주택에서 라돈 수준을 예측하는 것은 도입 베이지안 계층 적 모델링의 고전적인 문제이다 겔만과 힐 (2006) . 우리는 주택의 라돈 측정을 예측하기 위해 계층적 선형 모델을 구축할 것입니다. 여기서 계층은 카운티별로 주택을 그룹화한 것입니다. 우리는 미네소타에서 주택의 라돈 수준에 대한 위치(카운티)의 영향에 대한 신뢰할 수 있는 간격에 관심이 있습니다. 이 효과를 분리하기 위해 바닥 및 우라늄 수준의 영향도 모델에 포함됩니다. 또한 카운티별로 측정한 평균 층수에 해당하는 컨텍스트 효과를 통합하여 측정한 층의 카운티 간 편차가 있는 경우 이는 카운티 효과에 기인하지 않도록 합니다.
pip3 install -q tf-nightly tfp-nightly
import matplotlib.pyplot as plt
import numpy as np
import seaborn as sns
import tensorflow as tf
import tensorflow_datasets as tfds
import tensorflow_probability as tfp
import warnings

tfd = tfp.distributions
tfb = tfp.bijectors

plt.rcParams['figure.facecolor'] = '1.'
# Load the Radon dataset from `tensorflow_datasets` and filter to data from
# Minnesota.
dataset = tfds.as_numpy(
    tfds.load('radon', split='train').filter(
        lambda x: x['features']['state'] == 'MN').batch(10**9))

# Dependent variable: Radon measurements by house.
dataset = next(iter(dataset))
radon_measurement = dataset['activity'].astype(np.float32)
radon_measurement[radon_measurement <= 0.] = 0.1
log_radon = np.log(radon_measurement)

# Measured uranium concentrations in surrounding soil.
uranium_measurement = dataset['features']['Uppm'].astype(np.float32)
log_uranium = np.log(uranium_measurement)

# County indicator.
county_strings = dataset['features']['county'].astype('U13')
unique_counties, county = np.unique(county_strings, return_inverse=True)
county = county.astype(np.int32)
num_counties = unique_counties.size

# Floor on which the measurement was taken.
floor_of_house = dataset['features']['floor'].astype(np.int32)

# Average floor by county (contextual effect).
county_mean_floor = []
for i in range(num_counties):
  county_mean_floor.append(floor_of_house[county == i].mean())
county_mean_floor = np.array(county_mean_floor, dtype=log_radon.dtype)
floor_by_county = county_mean_floor[county]
회귀 모델은 다음과 같이 지정됩니다.
\(\newcommand{\Normal}{\operatorname{\sf Normal} }\){정렬} 시작 및 \ \ 텍스트 {uranium_weight를} \ SIM \ 정상 (0, 1) \ & \ 텍스트 {county_floor_weight} \ SIM \ 정상 (0, 1) \ & \ 텍스트 {대} J = 1 \ ldots \text{num_counties}:\ &\quad \text{county_effect}_j \sim \Normal (0, \sigma_c)\ &\text{for } i = 1\ldots n:\ &\quad \mu_i = ( \ 및 \ 쿼드 \ 쿼드 \ 텍스트 {바이어스} \ & \ 쿼드 \ 쿼드 + \ 텍스트 {군 효과} {\ 텍스트 {군} _i} \ & \ 쿼드 \ 쿼드 + \ 텍스트 {log_uranium} _i \ 시간 \ 텍스트 {uranium_weight } \ & \ 쿼드 \ 쿼드 + \ 텍스트 {floor_of_house} _i \ 시간 \ 텍스트 {floor_weight} \ & \ 쿼드 \ 쿼드 + \ 텍스트 {floor_by 군} {\ 텍스트 {군} _i} \ 시간 \ 텍스트 {county_floor_weight}) \ & \ 쿼드 \ 텍스트 {log_radon} _i (\ sigma_y \ mu_i) \ 단부 {정렬}있는 정상 \ SIM \ \(i\) 인덱스 관측 및 \(\text{county}_i\) 상기 군 인 \(i\)번째 관찰했다 찍은.
우리는 지리적 변동을 포착하기 위해 카운티 수준의 무작위 효과를 사용합니다. 파라미터는 uranium_weight 및 county_floor_weight 확률 모델링 및 floor_weight 상수의 bias 결정한다. 이러한 모델링 선택은 대체로 임의적이며 합리적인 복잡성의 확률 모델에서 VI를 시연할 목적으로 만들어집니다. 라돈 데이터 세트를 사용하여 총요소 생산성의 고정 및 임의 효과와 다단계 모델링의보다 철저한 토론을 참조 다단계 모델링 프라이머 및 변분 추론을 사용하여 피팅 일반화 선형 혼합 효과 모델 .
# Create variables for fixed effects.
floor_weight = tf.Variable(0.)
bias = tf.Variable(0.)

# Variables for scale parameters.
log_radon_scale = tfp.util.TransformedVariable(1., tfb.Exp())
county_effect_scale = tfp.util.TransformedVariable(1., tfb.Exp())

# Define the probabilistic graphical model as a JointDistribution.
@tfd.JointDistributionCoroutineAutoBatched
def model():
  uranium_weight = yield tfd.Normal(0., scale=1., name='uranium_weight')
  county_floor_weight = yield tfd.Normal(
      0., scale=1., name='county_floor_weight')
  county_effect = yield tfd.Sample(
      tfd.Normal(0., scale=county_effect_scale),
      sample_shape=[num_counties], name='county_effect')
  yield tfd.Normal(
      loc=(log_uranium * uranium_weight + floor_of_house* floor_weight
           + floor_by_county * county_floor_weight
           + tf.gather(county_effect, county, axis=-1)
           + bias),
      scale=log_radon_scale[..., tf.newaxis],
      name='log_radon')

# Pin the observed `log_radon` values to model the un-normalized posterior.
target_model = model.experimental_pin(log_radon=log_radon)
표현형 대리 사후
다음으로 서로 다른 두 가지 유형의 사후 대리인이 있는 VI를 사용하여 무작위 효과의 사후 분포를 추정합니다.
- 블록별 행렬 변환에 의해 유도된 공분산 구조가 있는 제약이 있는 다변량 정규 분포입니다.
- 에 의해 변형 다변량 표준 정규 분포를 역 회귀 흐름 다음 분할과 후방의 지원에 맞게 재구성된다.
다변수 정상 대리 후방
이 대리 사후 구성 요소를 만들기 위해 훈련 가능한 선형 연산자를 사용하여 사후 구성 요소 간의 상관 관계를 유도합니다.
# Determine the `event_shape` of the posterior, and calculate the size of each
# `event_shape` component. These determine the sizes of the components of the
# underlying standard Normal distribution, and the dimensions of the blocks in
# the blockwise matrix transformation.
event_shape = target_model.event_shape_tensor()
flat_event_shape = tf.nest.flatten(event_shape)
flat_event_size = tf.nest.map_structure(tf.reduce_prod, flat_event_shape)

# The `event_space_bijector` maps unconstrained values (in R^n) to the support
# of the prior -- we'll need this at the end to constrain Multivariate Normal
# samples to the prior's support.
event_space_bijector = target_model.experimental_default_event_space_bijector()
컨스 JointDistribution 대응하는 종래 구성에 의해 결정된 크기를 갖는 벡터 값 표준 정규 구성 요소들을. 구성 요소는 선형 연산자로 변환할 수 있도록 벡터 값이어야 합니다.
base_standard_dist = tfd.JointDistributionSequential(
      [tfd.Sample(tfd.Normal(0., 1.), s) for s in flat_event_size])
훈련 가능한 블록별 하부 삼각 선형 연산자를 구축합니다. 우리는 이것을 표준 정규 분포에 적용하여 (훈련 가능한) 블록별 행렬 변환을 구현하고 사후의 상관 구조를 유도합니다.
제로 (또는 블록 상태 블록 단위 선형 연산자 내에서, 학습 가능한 전체 행렬 블록은 상기 후방의 두 개의 구성 요소 사이의 전체 공분산을 나타낸다 None ) 독립을 나타낸다. 대각선의 블록은 하부 삼각 행렬 또는 대각 행렬이므로 전체 블록 구조가 하부 삼각 행렬을 나타냅니다.
이 바이젝터를 기본 분포에 적용하면 평균이 0이고 하부 삼각 블록 행렬과 동일한 (Cholesky-factored) 공분산을 갖는 다변량 정규 분포가 생성됩니다.
operators = (
    (tf.linalg.LinearOperatorDiag,),  # Variance of uranium weight (scalar).
    (tf.linalg.LinearOperatorFullMatrix,  # Covariance between uranium and floor-by-county weights.
     tf.linalg.LinearOperatorDiag),  # Variance of floor-by-county weight (scalar).
    (None,  # Independence between uranium weight and county effects.
     None,  #  Independence between floor-by-county and county effects.
     tf.linalg.LinearOperatorDiag)  # Independence among the 85 county effects.
    )

block_tril_linop = (
    tfp.experimental.vi.util.build_trainable_linear_operator_block(
        operators, flat_event_size))
scale_bijector = tfb.ScaleMatvecLinearOperatorBlock(block_tril_linop)
표준 정규 분포에 선형 연산자를 적용한 후, 여러 부분에 적용 Shift 평균 0이 아닌 값을 가질 수 있도록 bijector을.
loc_bijector = tfb.JointMap(
    tf.nest.map_structure(
        lambda s: tfb.Shift(
            tf.Variable(tf.random.uniform(
                (s,), minval=-2., maxval=2., dtype=tf.float32))),
        flat_event_size))
척도 및 위치 바이젝터를 사용하여 표준 정규 분포를 변환하여 얻은 결과 다변량 정규 분포는 이전 버전과 일치하도록 모양을 변경하고 재구성해야 하며 최종적으로 이전 버전의 지원으로 제한되어야 합니다.
# Reshape each component to match the prior, using a nested structure of
# `Reshape` bijectors wrapped in `JointMap` to form a multipart bijector.
reshape_bijector = tfb.JointMap(
    tf.nest.map_structure(tfb.Reshape, flat_event_shape))

# Restructure the flat list of components to match the prior's structure
unflatten_bijector = tfb.Restructure(
        tf.nest.pack_sequence_as(
            event_shape, range(len(flat_event_shape))))
이제 모든 것을 함께 모으세요. 훈련 가능한 바이젝터를 함께 연결하고 기본 표준 정규 분포에 적용하여 대리 후방을 구성합니다.
surrogate_posterior = tfd.TransformedDistribution(
    base_standard_dist,
    bijector = tfb.Chain(  # Note that the chained bijectors are applied in reverse order
        [
         event_space_bijector,  # constrain the surrogate to the support of the prior
         unflatten_bijector,  # pack the reshaped components into the `event_shape` structure of the posterior
         reshape_bijector,  # reshape the vector-valued components to match the shapes of the posterior components
         loc_bijector,  # allow for nonzero mean
         scale_bijector  # apply the block matrix transformation to the standard Normal distribution
         ]))
다변수 Normal surrogate posterior를 훈련시킵니다.
optimizer = tf.optimizers.Adam(learning_rate=1e-2)
mvn_loss = tfp.vi.fit_surrogate_posterior(
    target_model.unnormalized_log_prob,
    surrogate_posterior,
    optimizer=optimizer,
    num_steps=10**4,
    sample_size=16,
    jit_compile=True)

mvn_samples = surrogate_posterior.sample(1000)
mvn_final_elbo = tf.reduce_mean(
    target_model.unnormalized_log_prob(*mvn_samples)
    - surrogate_posterior.log_prob(mvn_samples))

print('Multivariate Normal surrogate posterior ELBO: {}'.format(mvn_final_elbo))

plt.plot(mvn_loss)
plt.xlabel('Training step')
_ = plt.ylabel('Loss value')
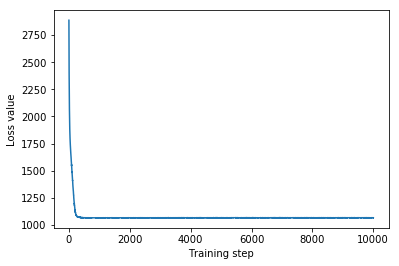
Multivariate Normal surrogate posterior ELBO: -1065.705322265625
훈련된 사후 대리인은 TFP 분포이므로 샘플을 가져와 처리하여 매개변수에 대한 사후 신뢰할 수 있는 구간을 생성할 수 있습니다.
박스 앤 수염 플롯은 50 % 이하 95 % 보여 신뢰할 수있는 간격 카운티 카운티 토양 우라늄 측정에 가장 큰 두 군 회귀 가중치의 효과와 평균 층을 위해. 카운티 효과에 대한 사후 신뢰 구간은 다른 변수를 고려한 후 St. Louis 카운티의 위치가 더 낮은 라돈 수준과 연관되고 Hennepin 카운티의 위치 효과가 거의 중립임을 나타냅니다.
회귀 가중치에 대한 사후 신뢰 구간은 토양 우라늄 수준이 높을수록 라돈 수준이 더 높은 것과 관련이 있으며 더 높은 층에서 측정이 수행된 카운티(집에 지하실이 없었기 때문일 수 있음)는 더 높은 수준의 라돈을 갖는 경향이 있음을 보여줍니다. 이는 토양 특성과 건설된 구조물의 유형에 미치는 영향과 관련될 수 있습니다.
바닥의 (결정론적) 계수는 음수이며, 예상대로 낮은 층이 더 높은 라돈 수준을 가짐을 나타냅니다.
st_louis_co = 69  # Index of St. Louis, the county with the most observations.
hennepin_co = 25  # Index of Hennepin, with the second-most observations.

def pack_samples(samples):
  return {'County effect (St. Louis)': samples.county_effect[..., st_louis_co],
          'County effect (Hennepin)': samples.county_effect[..., hennepin_co],
          'Uranium weight': samples.uranium_weight,
          'Floor-by-county weight': samples.county_floor_weight}

def plot_boxplot(posterior_samples):
  fig, axes = plt.subplots(1, 4, figsize=(16, 4))

  # Invert the results dict for easier plotting.
  k = list(posterior_samples.values())[0].keys()
  plot_results = {
      v: {p: posterior_samples[p][v] for p in posterior_samples} for v in k}
  for i, (var, var_results) in enumerate(plot_results.items()):
    sns.boxplot(data=list(var_results.values()), ax=axes[i],
                width=0.18*len(var_results), whis=(2.5, 97.5))
    # axes[i].boxplot(list(var_results.values()), whis=(2.5, 97.5))
    axes[i].title.set_text(var)
    fs = 10 if len(var_results) < 4 else 8
    axes[i].set_xticklabels(list(var_results.keys()), fontsize=fs)

results = {'Multivariate Normal': pack_samples(mvn_samples)}

print('Bias is: {:.2f}'.format(bias.numpy()))
print('Floor fixed effect is: {:.2f}'.format(floor_weight.numpy()))
plot_boxplot(results)
Bias is: 1.40
Floor fixed effect is: -0.72

역 자기회귀 흐름 대리 사후
역 자기회귀 흐름(IAF)은 신경망을 사용하여 분포 구성 요소 간의 복잡한 비선형 종속성을 캡처하는 흐름을 정규화합니다. 다음으로 우리는 이 고용량, 더 유연한 모델이 제한된 다변량 Normal을 능가하는지 확인하기 위해 IAF 대리 사후를 구축합니다.
# Build a standard Normal with a vector `event_shape`, with length equal to the
# total number of degrees of freedom in the posterior.
base_distribution = tfd.Sample(
    tfd.Normal(0., 1.), sample_shape=[tf.reduce_sum(flat_event_size)])

# Apply an IAF to the base distribution.
num_iafs = 2
iaf_bijectors = [
    tfb.Invert(tfb.MaskedAutoregressiveFlow(
        shift_and_log_scale_fn=tfb.AutoregressiveNetwork(
            params=2, hidden_units=[256, 256], activation='relu')))
    for _ in range(num_iafs)
]

# Split the base distribution's `event_shape` into components that are equal
# in size to the prior's components.
split = tfb.Split(flat_event_size)

# Chain these bijectors and apply them to the standard Normal base distribution
# to build the surrogate posterior. `event_space_bijector`,
# `unflatten_bijector`, and `reshape_bijector` are the same as in the
# multivariate Normal surrogate posterior.
iaf_surrogate_posterior = tfd.TransformedDistribution(
    base_distribution,
    bijector=tfb.Chain([
         event_space_bijector,  # constrain the surrogate to the support of the prior
         unflatten_bijector,  # pack the reshaped components into the `event_shape` structure of the prior
         reshape_bijector,  # reshape the vector-valued components to match the shapes of the prior components
         split] +  # Split the samples into components of the same size as the prior components
         iaf_bijectors  # Apply a flow model to the Tensor-valued standard Normal distribution
         ))
IAF 대리 후방을 훈련시킵니다.
optimizer=tf.optimizers.Adam(learning_rate=1e-2)
iaf_loss = tfp.vi.fit_surrogate_posterior(
  target_model.unnormalized_log_prob,
  iaf_surrogate_posterior,
  optimizer=optimizer,
  num_steps=10**4,
  sample_size=4,
  jit_compile=True)

iaf_samples = iaf_surrogate_posterior.sample(1000)
iaf_final_elbo = tf.reduce_mean(
    target_model.unnormalized_log_prob(*iaf_samples)
    - iaf_surrogate_posterior.log_prob(iaf_samples))
print('IAF surrogate posterior ELBO: {}'.format(iaf_final_elbo))

plt.plot(iaf_loss)
plt.xlabel('Training step')
_ = plt.ylabel('Loss value')
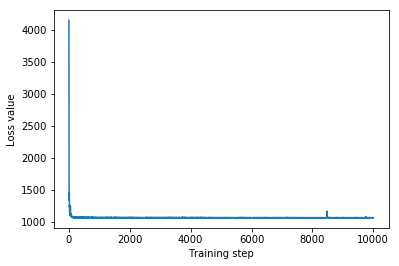
IAF surrogate posterior ELBO: -1065.3663330078125
IAF 대리 사후에 대한 신뢰할 수 있는 구간은 제약된 다변량 정규의 것과 유사하게 나타납니다.
results['IAF'] = pack_samples(iaf_samples)
plot_boxplot(results)

기준선: 평균 필드 대리 후부
VI 대리 사후는 전단사 변환을 통해 사전의 지원으로 제한되는 훈련 가능한 평균 및 분산이 있는 평균 필드(독립) 정규 분포로 종종 가정됩니다. 우리는 다변량 Normal surrogate posterior와 동일한 일반 공식을 사용하여 2개의 더 많은 표현 surrogate posterior와 함께 mean-field surrogate posterior를 정의합니다.
# A block-diagonal linear operator, in which each block is a diagonal operator,
# transforms the standard Normal base distribution to produce a mean-field
# surrogate posterior.
operators = (tf.linalg.LinearOperatorDiag,
             tf.linalg.LinearOperatorDiag,
             tf.linalg.LinearOperatorDiag)
block_diag_linop = (
    tfp.experimental.vi.util.build_trainable_linear_operator_block(
        operators, flat_event_size))
mean_field_scale = tfb.ScaleMatvecLinearOperatorBlock(block_diag_linop)

mean_field_loc = tfb.JointMap(
    tf.nest.map_structure(
        lambda s: tfb.Shift(
            tf.Variable(tf.random.uniform(
                (s,), minval=-2., maxval=2., dtype=tf.float32))),
        flat_event_size))

mean_field_surrogate_posterior = tfd.TransformedDistribution(
    base_standard_dist,
    bijector = tfb.Chain(  # Note that the chained bijectors are applied in reverse order
        [
         event_space_bijector,  # constrain the surrogate to the support of the prior
         unflatten_bijector,  # pack the reshaped components into the `event_shape` structure of the posterior
         reshape_bijector, # reshape the vector-valued components to match the shapes of the posterior components
         mean_field_loc,   # allow for nonzero mean
         mean_field_scale  # apply the block matrix transformation to the standard Normal distribution
         ]))

optimizer=tf.optimizers.Adam(learning_rate=1e-2)
mean_field_loss = tfp.vi.fit_surrogate_posterior(
    target_model.unnormalized_log_prob,
    mean_field_surrogate_posterior,
    optimizer=optimizer,
    num_steps=10**4,
    sample_size=16,
    jit_compile=True)

mean_field_samples = mean_field_surrogate_posterior.sample(1000)
mean_field_final_elbo = tf.reduce_mean(
    target_model.unnormalized_log_prob(*mean_field_samples)
    - mean_field_surrogate_posterior.log_prob(mean_field_samples))
print('Mean-field surrogate posterior ELBO: {}'.format(mean_field_final_elbo))

plt.plot(mean_field_loss)
plt.xlabel('Training step')
_ = plt.ylabel('Loss value')
Mean-field surrogate posterior ELBO: -1065.7652587890625
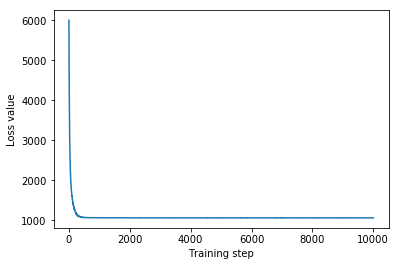
이 경우, 평균 필드 대리 사후는 더 표현적인 대리 사후와 유사한 결과를 제공하며, 이 더 간단한 모델이 추론 작업에 적합할 수 있음을 나타냅니다.
results['Mean Field'] = pack_samples(mean_field_samples)
plot_boxplot(results)

실측: Hamiltonian Monte Carlo(HMC)
우리는 HMC를 사용하여 대리 사후의 결과와 비교하기 위해 실제 사후에서 "실제" 샘플을 생성합니다.
num_chains = 8
num_leapfrog_steps = 3
step_size = 0.4
num_steps=20000

flat_event_shape = tf.nest.flatten(target_model.event_shape)
enum_components = list(range(len(flat_event_shape)))
bijector = tfb.Restructure(
    enum_components,
    tf.nest.pack_sequence_as(target_model.event_shape, enum_components))(
        target_model.experimental_default_event_space_bijector())

current_state = bijector(
    tf.nest.map_structure(
        lambda e: tf.zeros([num_chains] + list(e), dtype=tf.float32),
    target_model.event_shape))

hmc = tfp.mcmc.HamiltonianMonteCarlo(
    target_log_prob_fn=target_model.unnormalized_log_prob,
    num_leapfrog_steps=num_leapfrog_steps,
    step_size=[tf.fill(s.shape, step_size) for s in current_state])

hmc = tfp.mcmc.TransformedTransitionKernel(
    hmc, bijector)
hmc = tfp.mcmc.DualAveragingStepSizeAdaptation(
    hmc,
    num_adaptation_steps=int(num_steps // 2 * 0.8),
    target_accept_prob=0.9)

chain, is_accepted = tf.function(
    lambda current_state: tfp.mcmc.sample_chain(
        current_state=current_state,
        kernel=hmc,
        num_results=num_steps // 2,
        num_burnin_steps=num_steps // 2,
        trace_fn=lambda _, pkr:
        (pkr.inner_results.inner_results.is_accepted),
        ),
    autograph=False,
    jit_compile=True)(current_state)

accept_rate = tf.reduce_mean(tf.cast(is_accepted, tf.float32))
ess = tf.nest.map_structure(
    lambda c: tfp.mcmc.effective_sample_size(
        c,
        cross_chain_dims=1,
        filter_beyond_positive_pairs=True),
    chain)

r_hat = tf.nest.map_structure(tfp.mcmc.potential_scale_reduction, chain)
hmc_samples = pack_samples(
    tf.nest.pack_sequence_as(target_model.event_shape, chain))
print('Acceptance rate is {}'.format(accept_rate))
Acceptance rate is 0.9008625149726868
HMC 결과의 온전성 검사를 위해 샘플 추적을 플로팅합니다.
def plot_traces(var_name, samples):
  fig, axes = plt.subplots(1, 2, figsize=(14, 1.5), sharex='col', sharey='col')
  for chain in range(num_chains):
    s = samples.numpy()[:, chain]
    axes[0].plot(s, alpha=0.7)
    sns.kdeplot(s, ax=axes[1], shade=False)
    axes[0].title.set_text("'{}' trace".format(var_name))
    axes[1].title.set_text("'{}' distribution".format(var_name))
    axes[0].set_xlabel('Iteration')

warnings.filterwarnings('ignore')
for var, var_samples in hmc_samples.items():
  plot_traces(var, var_samples)


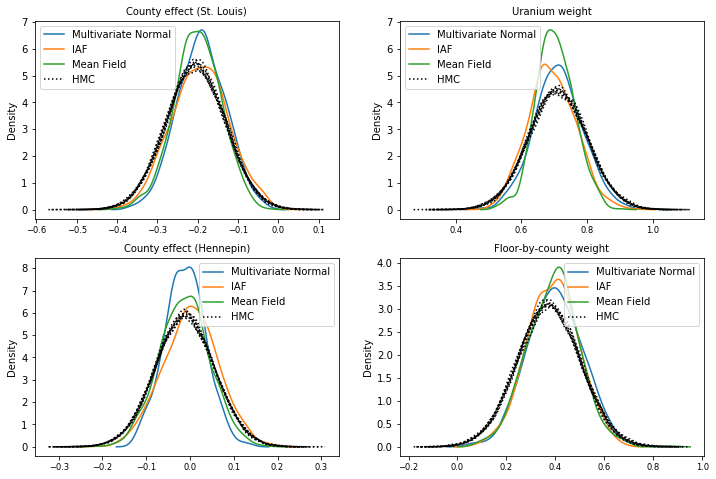
세 가지 대리 사후 모두 HMC 샘플과 시각적으로 유사한 신뢰할 수 있는 구간을 생성했지만 VI에서 일반적으로 ELBO 손실의 영향으로 인해 가끔 과소 분산됩니다.
results['HMC'] = hmc_samples
plot_boxplot(results)

추가 결과
플로팅 기능
plt.rcParams.update({'axes.titlesize': 'medium', 'xtick.labelsize': 'medium'})
def plot_loss_and_elbo():
  fig, axes = plt.subplots(1, 2, figsize=(12, 4))

  axes[0].scatter([0, 1, 2],
                  [mvn_final_elbo.numpy(),
                  iaf_final_elbo.numpy(),
                  mean_field_final_elbo.numpy()])
  axes[0].set_xticks(ticks=[0, 1, 2])
  axes[0].set_xticklabels(labels=[
    'Multivariate Normal', 'IAF', 'Mean Field'])
  axes[0].title.set_text('Evidence Lower Bound (ELBO)')

  axes[1].plot(mvn_loss, label='Multivariate Normal')
  axes[1].plot(iaf_loss, label='IAF')
  axes[1].plot(mean_field_loss, label='Mean Field')
  axes[1].set_ylim([1000, 4000])
  axes[1].set_xlabel('Training step')
  axes[1].set_ylabel('Loss (negative ELBO)')
  axes[1].title.set_text('Loss')
  plt.legend()
  plt.show()

plt.rcParams.update({'axes.titlesize': 'medium', 'xtick.labelsize': 'small'})
def plot_kdes(num_chains=8):
  fig, axes = plt.subplots(2, 2, figsize=(12, 8))
  k = list(results.values())[0].keys()
  plot_results = {
      v: {p: results[p][v] for p in results} for v in k}
  for i, (var, var_results) in enumerate(plot_results.items()):
    ax = axes[i % 2, i // 2]
    for posterior, posterior_results in var_results.items():
      if posterior == 'HMC':
        label = posterior
        for chain in range(num_chains):
          sns.kdeplot(
              posterior_results[:, chain],
              ax=ax, shade=False, color='k', linestyle=':', label=label)
          label=None
      else:
        sns.kdeplot(
            posterior_results, ax=ax, shade=False, label=posterior)
        ax.title.set_text('{}'.format(var))
    ax.legend()
증거 하한(ELBO)
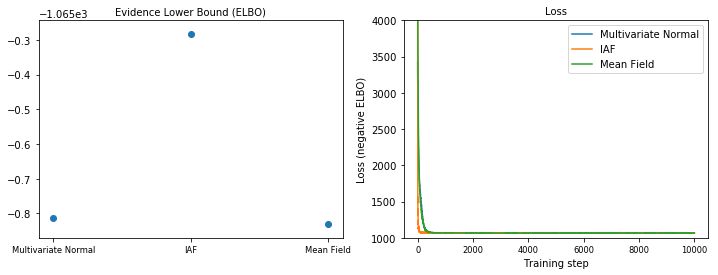
IAF는 지금까지 가장 크고 가장 유연한 대리 후방으로, 가장 높은 ELBO(Evidence Lower Bound)로 수렴합니다.
plot_loss_and_elbo()
후방 샘플
HMC ground truth 샘플과 비교한 각 대리 사후의 샘플(상자 플롯에 표시된 샘플의 다른 시각화).
plot_kdes()
결론
이 Colab에서는 관절 분포와 다중 부분 바이젝터를 사용하여 VI 대리 사후 구조를 구축하고 라돈 데이터 세트의 회귀 모델에서 가중치에 대한 신뢰할 수 있는 구간을 추정하기 위해 이를 맞췄습니다. 이 간단한 모델의 경우, 보다 표현적인 대리 사후 사후 평균 필드와 유사하게 수행됩니다. 그러나 우리가 시연한 도구는 보다 복잡한 모델에 적합한 광범위한 유연한 대리 후방을 구축하는 데 사용할 수 있습니다.
