ตัวอย่างนี้เป็นลางจากตัวอย่าง PyMC3 โน้ตบุ๊ค รองพื้นบนคชกรรมวิธีการในการสร้างแบบจำลองหลายระดับ
 ดูบน TensorFlow.org ดูบน TensorFlow.org |  ทำงานใน Google Colab ทำงานใน Google Colab |  ดูแหล่งที่มาบน GitHub ดูแหล่งที่มาบน GitHub |  ดาวน์โหลดโน๊ตบุ๊ค ดาวน์โหลดโน๊ตบุ๊ค |
การพึ่งพาและข้อกำหนดเบื้องต้น
นำเข้า
import collections
import os
from six.moves import urllib
import daft as daft
import matplotlib as mpl
import matplotlib.pyplot as plt
import numpy as np
import pandas as pd
import seaborn as sns
import warnings

import tensorflow.compat.v2 as tf
tf.enable_v2_behavior()

import tensorflow_datasets as tfds
import tensorflow_probability as tfp

tfk = tf.keras
tfkl = tf.keras.layers
tfpl = tfp.layers
tfd = tfp.distributions
tfb = tfp.bijectors

warnings.simplefilter('ignore')
1. บทนำ
ใน Colab นี้เราจะพอดีกับแบบจำลองเชิงเส้นลำดับชั้น (HLMs) องศาต่างๆของความซับซ้อนของโมเดลโดยใช้ชุดข้อมูลเรดอนนิยม เราจะใช้ประโยชน์จาก TFP ดั้งเดิมและชุดเครื่องมือ Markov Chain Monte Carlo
เพื่อให้เหมาะสมกับข้อมูลมากขึ้น เป้าหมายของเราคือการใช้โครงสร้างลำดับชั้นตามธรรมชาติที่มีอยู่ในชุดข้อมูล เราเริ่มต้นด้วยวิธีการทั่วไป: แบบจำลองที่รวมกลุ่มทั้งหมดและแบบแยกส่วน เราดำเนินการต่อด้วยแบบจำลองหลายระดับ: สำรวจแบบจำลองการรวมบางส่วน ตัวทำนายระดับกลุ่ม และผลกระทบตามบริบท
สำหรับโน๊ตบุ๊คที่เกี่ยวข้องยังกระชับ HLMs ใช้ TFP ในชุดข้อมูลที่เรดอนตรวจสอบ เชิงเส้นผสมผลการถดถอยใน {TF น่าจะเป็น R, สแตน}
หากคุณมีคำถามใด ๆ เกี่ยวกับวัสดุที่นี่อย่าลังเลที่จะติดต่อ (หรือเข้าร่วม) TensorFlow ความน่าจะเป็นรายการทางไปรษณีย์ เรายินดีที่จะช่วยเหลือ
2 ภาพรวมการสร้างแบบจำลองหลายระดับ
A Primer on Bayesian Methods สำหรับการสร้างแบบจำลองหลายระดับ
แบบจำลองลำดับชั้นหรือหลายระดับเป็นลักษณะทั่วไปของแบบจำลองการถดถอย
ตัวแบบหลายระดับคือตัวแบบการถดถอยซึ่งพารามิเตอร์ของแบบจำลององค์ประกอบจะได้รับการแจกแจงความน่าจะเป็น นี่หมายความว่าพารามิเตอร์โมเดลได้รับอนุญาตให้แตกต่างกันไปตามกลุ่ม หน่วยสังเกตการณ์มักจะจัดกลุ่มโดยธรรมชาติ การทำคลัสเตอร์ทำให้เกิดการพึ่งพากันระหว่างการสังเกต แม้จะสุ่มตัวอย่างกลุ่มและการสุ่มตัวอย่างภายในคลัสเตอร์
โมเดลลำดับชั้นคือโมเดลหลายระดับเฉพาะที่พารามิเตอร์ซ้อนกันอยู่ภายในอีกอันหนึ่ง โครงสร้างหลายระดับบางโครงสร้างไม่มีลำดับชั้น
เช่น "ประเทศ" และ "ปี" ไม่ได้ซ้อนกัน แต่อาจเป็นตัวแทนของกลุ่มพารามิเตอร์ที่แยกจากกัน แต่ทับซ้อนกัน เราจะกระตุ้นหัวข้อนี้โดยใช้ตัวอย่างระบาดวิทยาสิ่งแวดล้อม
ตัวอย่าง: การปนเปื้อนเรดอน (Gelman and Hill 2006)
เรดอนเป็นก๊าซกัมมันตภาพรังสีที่เข้าสู่บ้านเรือนผ่านจุดสัมผัสพื้น เป็นสารก่อมะเร็งที่เป็นสาเหตุหลักของมะเร็งปอดในผู้ไม่สูบบุหรี่ ระดับเรดอนแตกต่างกันไปในแต่ละครัวเรือน
EPA ได้ทำการศึกษาระดับเรดอนในบ้าน 80,000 หลัง ตัวทำนายที่สำคัญสองประการคือ 1. การวัดในห้องใต้ดินหรือชั้นหนึ่ง (เรดอนสูงกว่าในห้องใต้ดิน) 2. ระดับยูเรเนียมในมณฑล (ความสัมพันธ์เชิงบวกกับระดับเรดอน)
เราจะมุ่งเน้นไปที่การสร้างแบบจำลองระดับเรดอนในมินนิโซตา ลำดับชั้นในตัวอย่างนี้คือครัวเรือนภายในแต่ละเขต
3 Data Munging
ในส่วนนี้เราได้รับ radon ชุดข้อมูล และทำบาง preprocessing น้อยที่สุด
def load_and_preprocess_radon_dataset(state='MN'):
  """Preprocess Radon dataset as done in "Bayesian Data Analysis" book.

  We filter to Minnesota data (919 examples) and preprocess to obtain the
  following features:
  - `log_uranium_ppm`: Log of soil uranium measurements.
  - `county`: Name of county in which the measurement was taken.
  - `floor`: Floor of house (0 for basement, 1 for first floor) on which the
    measurement was taken.

  The target variable is `log_radon`, the log of the Radon measurement in the
  house.
  """
  ds = tfds.load('radon', split='train')
  radon_data = tfds.as_dataframe(ds)
  radon_data.rename(lambda s: s[9:] if s.startswith('feat') else s, axis=1, inplace=True)
  df = radon_data[radon_data.state==state.encode()].copy()

  # For any missing or invalid activity readings, we'll use a value of `0.1`.
  df['radon'] = df.activity.apply(lambda x: x if x > 0. else 0.1)
  # Make county names look nice.
  df['county'] = df.county.apply(lambda s: s.decode()).str.strip().str.title()
  # Remap categories to start from 0 and end at max(category).
  county_name = sorted(df.county.unique())
  df['county'] = df.county.astype(
      pd.api.types.CategoricalDtype(categories=county_name)).cat.codes
  county_name = list(map(str.strip, county_name))

  df['log_radon'] = df['radon'].apply(np.log)
  df['log_uranium_ppm'] = df['Uppm'].apply(np.log)
  df = df[['idnum', 'log_radon', 'floor', 'county', 'log_uranium_ppm']]

  return df, county_name
radon, county_name = load_and_preprocess_radon_dataset()
num_counties = len(county_name)
num_observations = len(radon)
# Create copies of variables as Tensors.
county = tf.convert_to_tensor(radon['county'], dtype=tf.int32)
floor = tf.convert_to_tensor(radon['floor'], dtype=tf.float32)
log_radon = tf.convert_to_tensor(radon['log_radon'], dtype=tf.float32)
log_uranium = tf.convert_to_tensor(radon['log_uranium_ppm'], dtype=tf.float32)
radon.head()
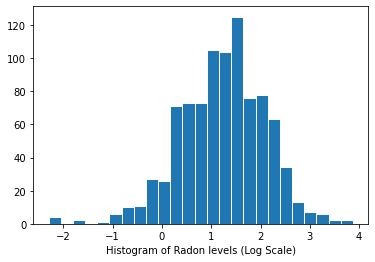
การกระจายระดับเรดอน (มาตราส่วนบันทึก):
plt.hist(log_radon.numpy(), bins=25, edgecolor='white')
plt.xlabel("Histogram of Radon levels (Log Scale)")
plt.show()
4 แนวทางทั่วไป
ทางเลือกทั่วไปสองทางสำหรับการสร้างแบบจำลองการเปิดรับเรดอนแสดงถึงสองสุดขั้วของการแลกเปลี่ยนความแปรปรวนอคติ:
การรวมบัญชีที่สมบูรณ์:
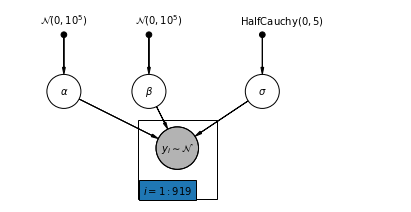
ปฏิบัติกับทุกมณฑลเหมือนกัน และประเมินระดับเรดอนเดียว
\[y_i = \alpha + \beta x_i + \epsilon_i\]
ไม่มีการพูล:
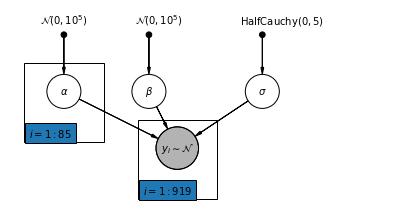
แบบจำลองเรดอนในแต่ละเขตอย่างอิสระ
\(y_i = \alpha_{j[i]} + \beta x_i + \epsilon_i\) ที่ \(j = 1,\ldots,85\)
ข้อผิดพลาด \(\epsilon_i\) อาจเป็นตัวแทนของวัดความผิดพลาดชั่วเปลี่ยนแปลงภายในบ้านหรือรูปแบบในหมู่บ้าน
4.1 โมเดลการรวมที่สมบูรณ์
pgm = daft.PGM([7, 3.5], node_unit=1.2)
pgm.add_node(
    daft.Node(
        "alpha_prior",
        r"$\mathcal{N}(0, 10^5)$",
        1,
        3,
        fixed=True,
        offset=(0, 5)))
pgm.add_node(
    daft.Node(
        "beta_prior",
        r"$\mathcal{N}(0, 10^5)$",
        2.5,
        3,
        fixed=True,
        offset=(10, 5)))
pgm.add_node(
    daft.Node(
        "sigma_prior",
        r"$\mathrm{HalfCauchy}(0, 5)$",
        4.5,
        3,
        fixed=True,
        offset=(20, 5)))
pgm.add_node(daft.Node("alpha", r"$\alpha$", 1, 2))
pgm.add_node(daft.Node("beta", r"$\beta$", 2.5, 2))
pgm.add_node(daft.Node("sigma", r"$\sigma$", 4.5, 2))
pgm.add_node(
    daft.Node(
        "y_i", r"$y_i \sim \mathcal{N}$", 3, 1, scale=1.25, observed=True))
pgm.add_edge("alpha_prior", "alpha")
pgm.add_edge("beta_prior", "beta")
pgm.add_edge("sigma_prior", "sigma")
pgm.add_edge("sigma", "y_i")
pgm.add_edge("alpha", "y_i")
pgm.add_edge("beta", "y_i")
pgm.add_plate(daft.Plate([2.3, 0.1, 1.4, 1.4], "$i = 1:919$"))

pgm.render()
plt.show()
ด้านล่างนี้ เราปรับโมเดลการรวมทั้งหมดโดยใช้ Hamiltonian Monte Carlo
@tf.function
def affine(x, kernel_diag, bias=tf.zeros([])):
  """`kernel_diag * x + bias` with broadcasting."""
  kernel_diag = tf.ones_like(x) * kernel_diag
  bias = tf.ones_like(x) * bias
  return x * kernel_diag + bias
def pooled_model(floor):
  """Creates a joint distribution representing our generative process."""
  return tfd.JointDistributionSequential([
      tfd.Normal(loc=0., scale=1e5),  # alpha
      tfd.Normal(loc=0., scale=1e5),  # beta
      tfd.HalfCauchy(loc=0., scale=5),  # sigma
      lambda s, b1, b0: tfd.MultivariateNormalDiag(  # y
          loc=affine(floor, b1[..., tf.newaxis], b0[..., tf.newaxis]),
          scale_identity_multiplier=s)
  ])


@tf.function
def pooled_log_prob(alpha, beta, sigma):
  """Computes `joint_log_prob` pinned at `log_radon`."""
  return pooled_model(floor).log_prob([alpha, beta, sigma, log_radon])
@tf.function
def sample_pooled(num_chains, num_results, num_burnin_steps, num_observations):
  """Samples from the pooled model."""
  hmc = tfp.mcmc.HamiltonianMonteCarlo(
      target_log_prob_fn=pooled_log_prob,
      num_leapfrog_steps=10,
      step_size=0.005)

  initial_state = [
      tf.zeros([num_chains], name='init_alpha'),
      tf.zeros([num_chains], name='init_beta'),
      tf.ones([num_chains], name='init_sigma')
  ]

  # Constrain `sigma` to the positive real axis. Other variables are
  # unconstrained.
  unconstraining_bijectors = [
      tfb.Identity(),  # alpha
      tfb.Identity(),  # beta
      tfb.Exp()        # sigma
  ]
  kernel = tfp.mcmc.TransformedTransitionKernel(
      inner_kernel=hmc, bijector=unconstraining_bijectors)

  samples, kernel_results = tfp.mcmc.sample_chain(
      num_results=num_results,
      num_burnin_steps=num_burnin_steps,
      current_state=initial_state,
      kernel=kernel)

  acceptance_probs = tf.reduce_mean(
      tf.cast(kernel_results.inner_results.is_accepted, tf.float32), axis=0)

  return samples, acceptance_probs
PooledModel = collections.namedtuple('PooledModel', ['alpha', 'beta', 'sigma'])

samples, acceptance_probs = sample_pooled(
    num_chains=4,
    num_results=1000,
    num_burnin_steps=1000,
    num_observations=num_observations)

print('Acceptance Probabilities for each chain: ', acceptance_probs.numpy())
pooled_samples = PooledModel._make(samples)
Acceptance Probabilities for each chain: [0.997 0.99 0.997 0.995]
for var, var_samples in pooled_samples._asdict().items():
  print('R-hat for ', var, ':\t',
        tfp.mcmc.potential_scale_reduction(var_samples).numpy())
R-hat for  alpha :     1.0046891
R-hat for  beta :  1.0128309
R-hat for  sigma :     1.0010641
def reduce_samples(var_samples, reduce_fn):
  """Reduces across leading two dims using reduce_fn."""
  # Collapse the first two dimensions, typically (num_chains, num_samples), and
  # compute np.mean or np.std along the remaining axis.
  if isinstance(var_samples, tf.Tensor):
    var_samples = var_samples.numpy() # convert to numpy array
  var_samples = np.reshape(var_samples, (-1,) +  var_samples.shape[2:])
  return np.apply_along_axis(reduce_fn, axis=0, arr=var_samples)

sample_mean = lambda samples : reduce_samples(samples, np.mean)
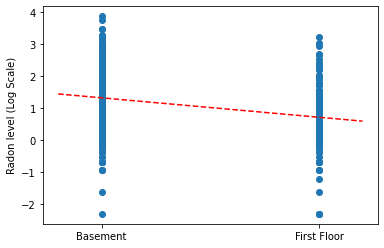
วาดค่าประมาณจุดของความชันและจุดตัดสำหรับแบบจำลองการรวมทั้งหมด
LinearEstimates = collections.namedtuple('LinearEstimates',
                                        ['intercept', 'slope'])

pooled_estimate = LinearEstimates(
  intercept=sample_mean(pooled_samples.alpha),
  slope=sample_mean(pooled_samples.beta)
)

plt.scatter(radon.floor, radon.log_radon)
xvals = np.linspace(-0.2, 1.2)
plt.ylabel('Radon level (Log Scale)')
plt.xticks([0, 1], ['Basement', 'First Floor'])
plt.plot(xvals, pooled_estimate.intercept + pooled_estimate.slope * xvals, 'r--')
plt.show()
ฟังก์ชันยูทิลิตี้เพื่อพล็อตการติดตามของตัวแปรตัวอย่าง
def plot_traces(var_name, samples, num_chains):
  if isinstance(samples, tf.Tensor):
    samples = samples.numpy() # convert to numpy array
  fig, axes = plt.subplots(1, 2, figsize=(14, 1.5), sharex='col', sharey='col')
  for chain in range(num_chains):
    axes[0].plot(samples[:, chain], alpha=0.7)
    axes[0].title.set_text("'{}' trace".format(var_name))
    sns.kdeplot(samples[:, chain], ax=axes[1], shade=False)
    axes[1].title.set_text("'{}' distribution".format(var_name))
    axes[0].set_xlabel('Iteration')
    axes[1].set_xlabel(var_name)
  plt.show()
for var, var_samples in pooled_samples._asdict().items():
  plot_traces(var, samples=var_samples, num_chains=4)


ต่อไป เราประเมินระดับเรดอนสำหรับแต่ละเคาน์ตีในแบบจำลองที่ไม่ได้รวมกลุ่ม
4.2 โมเดลที่ไม่ได้รวบรวม
pgm = daft.PGM([7, 3.5], node_unit=1.2)
pgm.add_node(
    daft.Node(
        "alpha_prior",
        r"$\mathcal{N}(0, 10^5)$",
        1,
        3,
        fixed=True,
        offset=(0, 5)))
pgm.add_node(
    daft.Node(
        "beta_prior",
        r"$\mathcal{N}(0, 10^5)$",
        2.5,
        3,
        fixed=True,
        offset=(10, 5)))
pgm.add_node(
    daft.Node(
        "sigma_prior",
        r"$\mathrm{HalfCauchy}(0, 5)$",
        4.5,
        3,
        fixed=True,
        offset=(20, 5)))
pgm.add_node(daft.Node("alpha", r"$\alpha$", 1, 2))
pgm.add_node(daft.Node("beta", r"$\beta$", 2.5, 2))
pgm.add_node(daft.Node("sigma", r"$\sigma$", 4.5, 2))
pgm.add_node(
    daft.Node(
        "y_i", r"$y_i \sim \mathcal{N}$", 3, 1, scale=1.25, observed=True))
pgm.add_edge("alpha_prior", "alpha")
pgm.add_edge("beta_prior", "beta")
pgm.add_edge("sigma_prior", "sigma")
pgm.add_edge("sigma", "y_i")
pgm.add_edge("alpha", "y_i")
pgm.add_edge("beta", "y_i")
pgm.add_plate(daft.Plate([0.3, 1.1, 1.4, 1.4], "$i = 1:85$"))
pgm.add_plate(daft.Plate([2.3, 0.1, 1.4, 1.4], "$i = 1:919$"))

pgm.render()
plt.show()
def unpooled_model(floor, county):
  """Creates a joint distribution for the unpooled model."""
  return tfd.JointDistributionSequential([
      tfd.MultivariateNormalDiag(       # alpha
          loc=tf.zeros([num_counties]), scale_identity_multiplier=1e5),
      tfd.Normal(loc=0., scale=1e5),    # beta
      tfd.HalfCauchy(loc=0., scale=5),  # sigma
      lambda s, b1, b0: tfd.MultivariateNormalDiag(  # y
          loc=affine(
            floor, b1[..., tf.newaxis], tf.gather(b0, county, axis=-1)),
          scale_identity_multiplier=s)
  ])


@tf.function
def unpooled_log_prob(beta0, beta1, sigma):
  """Computes `joint_log_prob` pinned at `log_radon`."""
  return (
    unpooled_model(floor, county).log_prob([beta0, beta1, sigma, log_radon]))
@tf.function
def sample_unpooled(num_chains, num_results, num_burnin_steps):
  """Samples from the unpooled model."""
  # Initialize the HMC transition kernel.
  hmc = tfp.mcmc.HamiltonianMonteCarlo(
      target_log_prob_fn=unpooled_log_prob,
      num_leapfrog_steps=10,
      step_size=0.025)

  initial_state = [
      tf.zeros([num_chains, num_counties], name='init_beta0'),
      tf.zeros([num_chains], name='init_beta1'),
      tf.ones([num_chains], name='init_sigma')
  ]
  # Contrain `sigma` to the positive real axis. Other variables are
  # unconstrained.
  unconstraining_bijectors = [
      tfb.Identity(),  # alpha
      tfb.Identity(),  # beta
      tfb.Exp()        # sigma
  ]
  kernel = tfp.mcmc.TransformedTransitionKernel(
      inner_kernel=hmc, bijector=unconstraining_bijectors)
  samples, kernel_results = tfp.mcmc.sample_chain(
      num_results=num_results,
      num_burnin_steps=num_burnin_steps,
      current_state=initial_state,
      kernel=kernel)

  acceptance_probs = tf.reduce_mean(
      tf.cast(kernel_results.inner_results.is_accepted, tf.float32), axis=0)

  return samples, acceptance_probs
UnpooledModel = collections.namedtuple('UnpooledModel',
                                       ['alpha', 'beta', 'sigma'])

samples, acceptance_probs = sample_unpooled(
    num_chains=4, num_results=1000, num_burnin_steps=1000)

print('Acceptance Probabilities: ', acceptance_probs.numpy())
unpooled_samples = UnpooledModel._make(samples)

print('R-hat for beta:',
      tfp.mcmc.potential_scale_reduction(unpooled_samples.beta).numpy())
print('R-hat for sigma:',
      tfp.mcmc.potential_scale_reduction(unpooled_samples.sigma).numpy())
Acceptance Probabilities:  [0.892 0.897 0.911 0.91 ]
R-hat for beta: 1.0079623
R-hat for sigma: 1.0059084
plot_traces(var_name='beta', samples=unpooled_samples.beta, num_chains=4)
plot_traces(var_name='sigma', samples=unpooled_samples.sigma, num_chains=4)


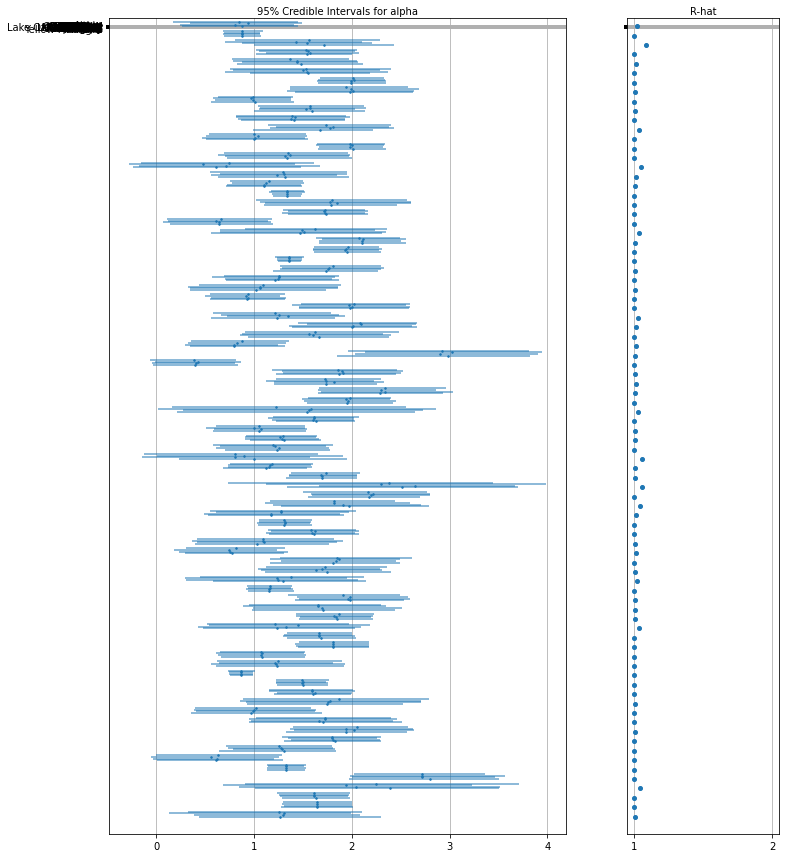
ต่อไปนี้คือค่าที่คาดหวังของเคาน์ตีที่ไม่ได้รวมกลุ่มสำหรับการสกัดกั้นพร้อมกับช่วงที่น่าเชื่อถือ 95% สำหรับแต่ละเชน นอกจากนี้เรายังรายงานมูลค่าหมวก R สำหรับการประมาณการของแต่ละเคาน์ตี
ฟังก์ชั่นยูทิลิตี้สำหรับแปลงป่า
def forest_plot(num_chains, num_vars, var_name, var_labels, samples):
  fig, axes = plt.subplots(
      1, 2, figsize=(12, 15), sharey=True, gridspec_kw={'width_ratios': [3, 1]})
  for var_idx in range(num_vars):
    values = samples[..., var_idx]
    rhat = tfp.mcmc.diagnostic.potential_scale_reduction(values).numpy()
    meds = np.median(values, axis=-2)
    los = np.percentile(values, 5, axis=-2)
    his = np.percentile(values, 95, axis=-2)

    for i in range(num_chains):
      height = 0.1 + 0.3 * var_idx + 0.05 * i
      axes[0].plot([los[i], his[i]], [height, height], 'C0-', lw=2, alpha=0.5)
      axes[0].plot([meds[i]], [height], 'C0o', ms=1.5)
    axes[1].plot([rhat], [height], 'C0o', ms=4)

  axes[0].set_yticks(np.linspace(0.2, 0.3, num_vars))
  axes[0].set_ylim(0, 26)
  axes[0].grid(which='both')
  axes[0].invert_yaxis()
  axes[0].set_yticklabels(var_labels)
  axes[0].xaxis.set_label_position('top')
  axes[0].set(xlabel='95% Credible Intervals for {}'.format(var_name))

  axes[1].set_xticks([1, 2])
  axes[1].set_xlim(0.95, 2.05)
  axes[1].grid(which='both')
  axes[1].set(xlabel='R-hat')
  axes[1].xaxis.set_label_position('top')

  plt.show()
forest_plot(
    num_chains=4,
    num_vars=num_counties,
    var_name='alpha',
    var_labels=county_name,
    samples=unpooled_samples.alpha.numpy())
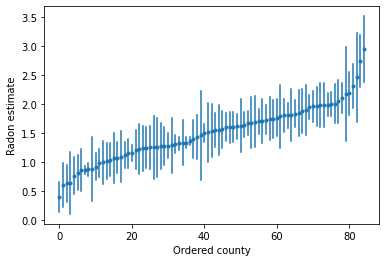
เราสามารถพล็อตค่าประมาณที่สั่งเพื่อระบุเขตที่มีระดับเรดอนสูง:
unpooled_intercepts = reduce_samples(unpooled_samples.alpha, np.mean)
unpooled_intercepts_se = reduce_samples(unpooled_samples.alpha, np.std)

def plot_ordered_estimates():
  means = pd.Series(unpooled_intercepts, index=county_name)
  std_errors = pd.Series(unpooled_intercepts_se, index=county_name)
  order = means.sort_values().index

  plt.plot(range(num_counties), means[order], '.')
  for i, m, se in zip(range(num_counties), means[order], std_errors[order]):
    plt.plot([i, i], [m - se, m + se], 'C0-')
  plt.xlabel('Ordered county')
  plt.ylabel('Radon estimate')
  plt.show()

plot_ordered_estimates()
ฟังก์ชันยูทิลิตี้เพื่อพล็อตค่าประมาณสำหรับชุดตัวอย่างของเคาน์ตี
def plot_estimates(linear_estimates, labels, sample_counties):
  fig, axes = plt.subplots(2, 4, figsize=(12, 6), sharey=True, sharex=True)
  axes = axes.ravel()
  intercepts_indexed = []
  slopes_indexed = []
  for intercepts, slopes in linear_estimates:
    intercepts_indexed.append(pd.Series(intercepts, index=county_name))
    slopes_indexed.append(pd.Series(slopes, index=county_name))

  markers = ['-', 'r--', 'k:']
  sample_county_codes = [county_name.index(c) for c in sample_counties]
  for i, c in enumerate(sample_county_codes):
    y = radon.log_radon[radon.county == c]
    x = radon.floor[radon.county == c]
    axes[i].scatter(
        x + np.random.randn(len(x)) * 0.01, y, alpha=0.4, label='Log Radon')

    # Plot both models and data
    xvals = np.linspace(-0.2, 1.2)
    for k in range(len(intercepts_indexed)):
      axes[i].plot(
          xvals,
          intercepts_indexed[k][c] + slopes_indexed[k][c] * xvals,
          markers[k],
          label=labels[k])

    axes[i].set_xticks([0, 1])
    axes[i].set_xticklabels(['Basement', 'First Floor'])
    axes[i].set_ylim(-1, 3)
    axes[i].set_title(sample_counties[i])
    if not i % 2:
      axes[i].set_ylabel('Log Radon level')
  axes[3].legend(bbox_to_anchor=(1.05, 0.9), borderaxespad=0.)

  plt.show()
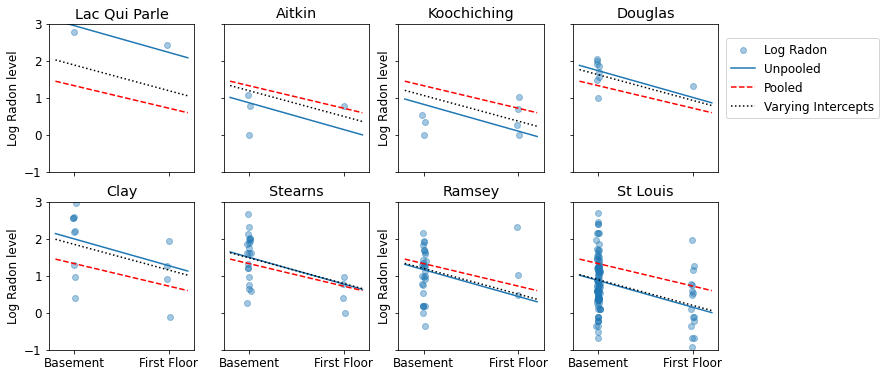
ต่อไปนี้คือการเปรียบเทียบภาพระหว่างการประมาณการแบบรวมกลุ่มและแบบไม่รวมกลุ่มสำหรับกลุ่มย่อยของเคาน์ตีที่แสดงช่วงของขนาดตัวอย่าง
unpooled_estimates = LinearEstimates(
  sample_mean(unpooled_samples.alpha),
  sample_mean(unpooled_samples.beta)
)

sample_counties = ('Lac Qui Parle', 'Aitkin', 'Koochiching', 'Douglas', 'Clay',
                   'Stearns', 'Ramsey', 'St Louis')
plot_estimates(
    linear_estimates=[unpooled_estimates, pooled_estimate],
    labels=['Unpooled Estimates', 'Pooled Estimates'],
    sample_counties=sample_counties)
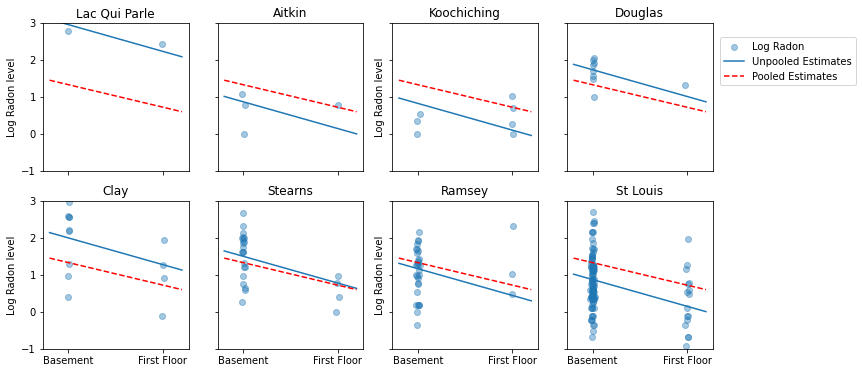
ทั้งสองรุ่นไม่เป็นที่น่าพอใจ:
- หากเรากำลังพยายามระบุเขตที่มีเรดอนสูง การรวมกลุ่มก็ไม่มีประโยชน์
- เราไม่เชื่อถือการประมาณการที่ไม่มีการรวบรวมข้อมูลอย่างมากซึ่งเกิดจากแบบจำลองโดยใช้การสังเกตเพียงเล็กน้อย
5 โมเดลหลายระดับและลำดับชั้น
เมื่อเรารวมข้อมูลเข้าด้วยกัน เราจะสูญเสียข้อมูลที่จุดข้อมูลต่างๆ มาจากมณฑลต่างๆ ซึ่งหมายความว่าแต่ละ radon สังเกตระดับพื้นดินเป็นตัวอย่างจากการกระจายความน่าจะเป็นแบบเดียวกัน โมเดลดังกล่าวไม่สามารถเรียนรู้การเปลี่ยนแปลงใดๆ ในหน่วยสุ่มตัวอย่างที่มีอยู่ภายในกลุ่ม (เช่น เคาน์ตี) บัญชีสำหรับความแปรปรวนการสุ่มตัวอย่างเท่านั้น
mpl.rc("font", size=18)

pgm = daft.PGM([13.6, 2.2], origin=[1.15, 1.0], node_ec="none")
pgm.add_node(daft.Node("parameter", r"parameter", 2.0, 3))
pgm.add_node(daft.Node("observations", r"observations", 2.0, 2))
pgm.add_node(daft.Node("theta", r"$\theta$", 5.5, 3))
pgm.add_node(daft.Node("y_0", r"$y_0$", 4, 2))
pgm.add_node(daft.Node("y_1", r"$y_1$", 5, 2))
pgm.add_node(daft.Node("dots", r"$\cdots$", 6, 2))
pgm.add_node(daft.Node("y_k", r"$y_k$", 7, 2))
pgm.add_edge("theta", "y_0")
pgm.add_edge("theta", "y_1")
pgm.add_edge("theta", "y_k")
pgm.render()
plt.show()

เมื่อเราวิเคราะห์ข้อมูลแบบ unpooled เราบอกเป็นนัยว่ามีการสุ่มตัวอย่างอย่างอิสระจากแบบจำลองที่แยกจากกัน ที่ขั้วตรงข้ามสุดขั้วจากกรณีรวม แนวทางนี้อ้างว่าความแตกต่างระหว่างหน่วยสุ่มตัวอย่างมีขนาดใหญ่เกินไปที่จะรวมเข้าด้วยกัน:
mpl.rc("font", size=18)

pgm = daft.PGM([13.6, 2.2], origin=[1.15, 1.0], node_ec="none")
pgm.add_node(daft.Node("parameter", r"parameter", 2.0, 3))
pgm.add_node(daft.Node("observations", r"observations", 2.0, 2))
pgm.add_node(daft.Node("theta_0", r"$\theta_0$", 4, 3))
pgm.add_node(daft.Node("theta_1", r"$\theta_1$", 5, 3))
pgm.add_node(daft.Node("theta_dots", r"$\cdots$", 6, 3))
pgm.add_node(daft.Node("theta_k", r"$\theta_k$", 7, 3))

pgm.add_node(daft.Node("y_0", r"$y_0$", 4, 2))
pgm.add_node(daft.Node("y_1", r"$y_1$", 5, 2))
pgm.add_node(daft.Node("y_dots", r"$\cdots$", 6, 2))
pgm.add_node(daft.Node("y_k", r"$y_k$", 7, 2))
pgm.add_edge("theta_0", "y_0")
pgm.add_edge("theta_1", "y_1")
pgm.add_edge("theta_k", "y_k")
pgm.render()
plt.show()

ในแบบจำลองลำดับชั้น พารามิเตอร์จะถูกมองว่าเป็นตัวอย่างจากการกระจายตัวของพารามิเตอร์ ดังนั้นเราจึงมองว่าไม่แตกต่างไปจากเดิมอย่างสิ้นเชิงหรือเหมือนกันทุกประการ นี้เรียกว่าร่วมกันบางส่วน
mpl.rc("font", size=18)

pgm = daft.PGM([13.6, 3.4], origin=[1.15, 1.0], node_ec="none")
pgm.add_node(daft.Node("model", r"model", 2.0, 4))
pgm.add_node(daft.Node("parameter", r"parameter", 2.0, 3))
pgm.add_node(daft.Node("observations", r"observations", 2.0, 2))
pgm.add_node(daft.Node("mu_sigma", r"$\mu,\sigma^2$", 5.5, 4))
pgm.add_node(daft.Node("theta_0", r"$\theta_0$", 4, 3))
pgm.add_node(daft.Node("theta_1", r"$\theta_1$", 5, 3))
pgm.add_node(daft.Node("theta_dots", r"$\cdots$", 6, 3))
pgm.add_node(daft.Node("theta_k", r"$\theta_k$", 7, 3))
pgm.add_node(daft.Node("y_0", r"$y_0$", 4, 2))
pgm.add_node(daft.Node("y_1", r"$y_1$", 5, 2))
pgm.add_node(daft.Node("y_dots", r"$\cdots$", 6, 2))
pgm.add_node(daft.Node("y_k", r"$y_k$", 7, 2))
pgm.add_edge("mu_sigma", "theta_0")
pgm.add_edge("mu_sigma", "theta_1")
pgm.add_edge("mu_sigma", "theta_k")
pgm.add_edge("theta_0", "y_0")
pgm.add_edge("theta_1", "y_1")
pgm.add_edge("theta_k", "y_k")
pgm.render()
plt.show()

5.1 การรวมบางส่วน
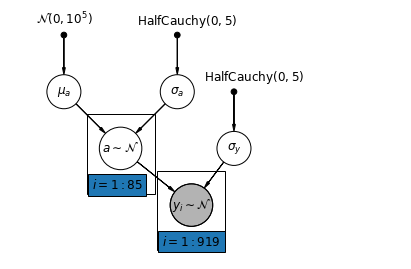
แบบจำลองการรวมบางส่วนที่ง่ายที่สุดสำหรับชุดข้อมูลเรดอนในครัวเรือนคือแบบจำลองที่ประเมินระดับเรดอนอย่างง่าย ๆ โดยไม่มีตัวทำนายใด ๆ ที่ระดับกลุ่มหรือระดับบุคคล ตัวอย่างของตัวทำนายระดับบุคคลคือว่าจุดข้อมูลมาจากชั้นใต้ดินหรือชั้นหนึ่ง ตัวทำนายระดับกลุ่มอาจเป็นระดับเฉลี่ยของยูเรเนียมทั่วทั้งประเทศ
แบบจำลองการรวมบางส่วนแสดงถึงการประนีประนอมระหว่างสุดขั้วแบบรวมกลุ่มและแบบไม่รวมกลุ่ม ประมาณค่าเฉลี่ยแบบถ่วงน้ำหนัก (ตามขนาดกลุ่มตัวอย่าง) ของการประมาณการเคาน์ตีแบบไม่รวมกลุ่มและการประมาณการแบบรวมกลุ่ม
ให้ \(\hat{\alpha}_j\) เป็นระดับเข้าสู่ระบบเรดอนประมาณในเขต \(j\)มันเป็นแค่การสกัดกั้น ตอนนี้เราละเลยความลาดชัน \(n_j\) เป็นจำนวนของการสังเกตจากเขต \(j\)\(\sigma_{\alpha}\) และ \(\sigma_y\) มีความแปรปรวนภายในพารามิเตอร์และความแปรปรวนของการสุ่มตัวอย่างตามลำดับ จากนั้นโมเดลการรวมบางส่วนสามารถวางได้:
\[\hat{\alpha}_j \approx \frac{(n_j/\sigma_y^2)\bar{y}_j + (1/\sigma_{\alpha}^2)\bar{y} }{(n_j/\sigma_y^2) + (1/\sigma_{\alpha}^2)}\]
เราคาดหวังสิ่งต่อไปนี้เมื่อใช้การรวมบางส่วน:
- ค่าประมาณของมณฑลที่มีขนาดตัวอย่างเล็กลงจะหดตัวลงสู่ค่าเฉลี่ยทั่วทั้งรัฐ
- การประมาณการสำหรับเคาน์ตีที่มีขนาดตัวอย่างที่ใหญ่กว่าจะใกล้เคียงกับการประมาณการของเคาน์ตีที่ไม่มีการรวบรวม
mpl.rc("font", size=12)
pgm = daft.PGM([7, 4.5], node_unit=1.2)
pgm.add_node(
    daft.Node(
        "mu_a_prior",
        r"$\mathcal{N}(0, 10^5)$",
        1,
        4,
        fixed=True,
        offset=(0, 5)))
pgm.add_node(
    daft.Node(
        "sigma_a_prior",
        r"$\mathrm{HalfCauchy}(0, 5)$",
        3,
        4,
        fixed=True,
        offset=(10, 5)))
pgm.add_node(
    daft.Node(
        "sigma_prior",
        r"$\mathrm{HalfCauchy}(0, 5)$",
        4,
        3,
        fixed=True,
        offset=(20, 5)))
pgm.add_node(daft.Node("mu_a", r"$\mu_a$", 1, 3))
pgm.add_node(daft.Node("sigma_a", r"$\sigma_a$", 3, 3))
pgm.add_node(daft.Node("a", r"$a \sim \mathcal{N}$", 2, 2, scale=1.25))
pgm.add_node(daft.Node("sigma_y", r"$\sigma_y$", 4, 2))
pgm.add_node(
    daft.Node(
        "y_i", r"$y_i \sim \mathcal{N}$", 3.25, 1, scale=1.25, observed=True))
pgm.add_edge("mu_a_prior", "mu_a")
pgm.add_edge("sigma_a_prior", "sigma_a")
pgm.add_edge("mu_a", "a")
pgm.add_edge("sigma_a", "a")
pgm.add_edge("sigma_prior", "sigma_y")
pgm.add_edge("sigma_y", "y_i")
pgm.add_edge("a", "y_i")
pgm.add_plate(daft.Plate([1.4, 1.2, 1.2, 1.4], "$i = 1:85$"))
pgm.add_plate(daft.Plate([2.65, 0.2, 1.2, 1.4], "$i = 1:919$"))

pgm.render()
plt.show()
def partial_pooling_model(county):
  """Creates a joint distribution for the partial pooling model."""
  return tfd.JointDistributionSequential([
      tfd.Normal(loc=0., scale=1e5),    # mu_a
      tfd.HalfCauchy(loc=0., scale=5),  # sigma_a
      lambda sigma_a, mu_a: tfd.MultivariateNormalDiag(  # a
          loc=mu_a[..., tf.newaxis] * tf.ones([num_counties])[tf.newaxis, ...],
          scale_identity_multiplier=sigma_a),
      tfd.HalfCauchy(loc=0., scale=5),  # sigma_y
      lambda sigma_y, a: tfd.MultivariateNormalDiag(  # y
          loc=tf.gather(a, county, axis=-1),
          scale_identity_multiplier=sigma_y)
  ])


@tf.function
def partial_pooling_log_prob(mu_a, sigma_a, a, sigma_y):
  """Computes joint log prob pinned at `log_radon`."""
  return partial_pooling_model(county).log_prob(
      [mu_a, sigma_a, a, sigma_y, log_radon])
@tf.function
def sample_partial_pooling(num_chains, num_results, num_burnin_steps):
  """Samples from the partial pooling model."""
  hmc = tfp.mcmc.HamiltonianMonteCarlo(
      target_log_prob_fn=partial_pooling_log_prob,
      num_leapfrog_steps=10,
      step_size=0.01)

  initial_state = [
      tf.zeros([num_chains], name='init_mu_a'),
      tf.ones([num_chains], name='init_sigma_a'),
      tf.zeros([num_chains, num_counties], name='init_a'),
      tf.ones([num_chains], name='init_sigma_y')
  ]
  unconstraining_bijectors = [
      tfb.Identity(),  # mu_a
      tfb.Exp(),       # sigma_a
      tfb.Identity(),  # a
      tfb.Exp()        # sigma_y
  ]
  kernel = tfp.mcmc.TransformedTransitionKernel(
      inner_kernel=hmc, bijector=unconstraining_bijectors)
  samples, kernel_results = tfp.mcmc.sample_chain(
      num_results=num_results,
      num_burnin_steps=num_burnin_steps,
      current_state=initial_state,
      kernel=kernel)

  acceptance_probs = tf.reduce_mean(
      tf.cast(kernel_results.inner_results.is_accepted, tf.float32), axis=0)

  return samples, acceptance_probs
PartialPoolingModel = collections.namedtuple(
    'PartialPoolingModel', ['mu_a', 'sigma_a', 'a', 'sigma_y'])

samples, acceptance_probs = sample_partial_pooling(
    num_chains=4, num_results=1000, num_burnin_steps=1000)

print('Acceptance Probabilities: ', acceptance_probs.numpy())
partial_pooling_samples = PartialPoolingModel._make(samples)
Acceptance Probabilities: [0.989 0.977 0.988 0.985]
for var in ['mu_a', 'sigma_a', 'sigma_y']:
  print(
      'R-hat for ', var, '\t:',
      tfp.mcmc.potential_scale_reduction(getattr(partial_pooling_samples,
                                                 var)).numpy())
R-hat for  mu_a     : 1.0216417
R-hat for  sigma_a  : 1.0224565
R-hat for  sigma_y  : 1.0016255
partial_pooling_intercepts = reduce_samples(
    partial_pooling_samples.a.numpy(), np.mean)
partial_pooling_intercepts_se = reduce_samples(
    partial_pooling_samples.a.numpy(), np.std)

def plot_unpooled_vs_partial_pooling_estimates():
  fig, axes = plt.subplots(1, 2, figsize=(14, 6), sharex=True, sharey=True)

  # Order counties by number of observations (and add some jitter).
  num_obs_per_county = (
      radon.groupby('county')['idnum'].count().values.astype(np.float32))
  num_obs_per_county += np.random.normal(scale=0.5, size=num_counties)

  intercepts_list = [unpooled_intercepts, partial_pooling_intercepts]
  intercepts_se_list = [unpooled_intercepts_se, partial_pooling_intercepts_se]

  for ax, means, std_errors in zip(axes, intercepts_list, intercepts_se_list):
    ax.plot(num_obs_per_county, means, 'C0.')
    for n, m, se in zip(num_obs_per_county, means, std_errors):
      ax.plot([n, n], [m - se, m + se], 'C1-', alpha=.5)

  for ax in axes:
    ax.set_xscale('log')
    ax.set_xlabel('No. of Observations Per County')
    ax.set_xlim(1, 100)
    ax.set_ylabel('Log Radon Estimate (with Standard Error)')
    ax.set_ylim(0, 3)
    ax.hlines(partial_pooling_intercepts.mean(), .9, 125, 'k', '--', alpha=.5)
  axes[0].set_title('Unpooled Estimates')
  axes[1].set_title('Partially Pooled Estimates')

plot_unpooled_vs_partial_pooling_estimates()
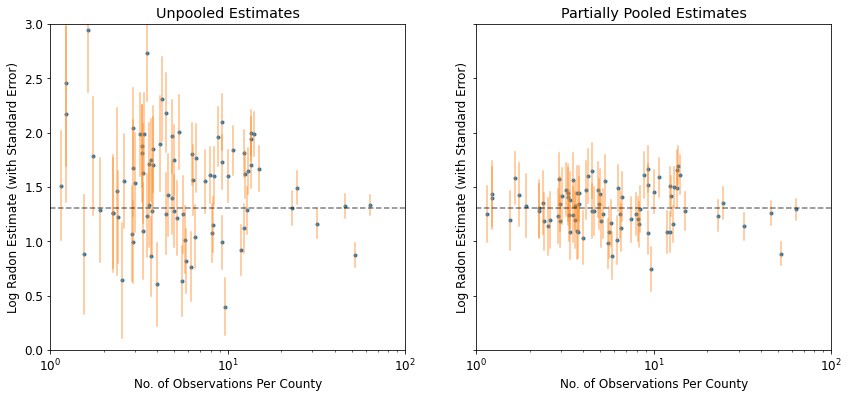
สังเกตความแตกต่างระหว่างการประมาณการแบบแยกส่วนและแบบรวมบางส่วน โดยเฉพาะอย่างยิ่งในขนาดตัวอย่างที่เล็กกว่า อดีตนั้นรุนแรงกว่าและไม่แม่นยำกว่า
5.2 การสกัดกั้นที่แตกต่างกัน
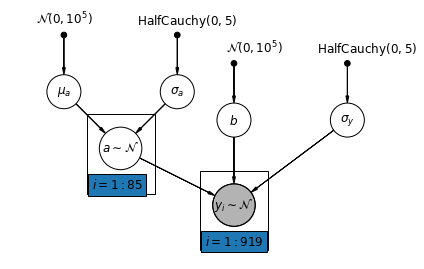
ตอนนี้เราพิจารณาโมเดลที่ซับซ้อนมากขึ้น ซึ่งช่วยให้การสกัดกั้นแตกต่างกันไปตามเขตต่างๆ ตามผลแบบสุ่ม
\(y_i = \alpha_{j[i]} + \beta x_{i} + \epsilon_i\) ที่\(\epsilon_i \sim N(0, \sigma_y^2)\) และตัดผลสุ่ม:
\[\alpha_{j[i]} \sim N(\mu_{\alpha}, \sigma_{\alpha}^2)\]
ความลาดชัน \(\beta\)ซึ่งจะช่วยให้การสังเกตแตกต่างกันตามสถานที่ตั้งของวัด (ชั้นใต้ดินหรือชั้นแรก) ที่ยังคงเป็นผลการแก้ไขร่วมกันระหว่างมณฑลที่แตกต่างกัน
เช่นเดียวกับรูปแบบ unpooling เราตั้งค่าตัดแยกต่างหากสำหรับแต่ละเขต แต่แทนที่จะกระชับแยกต่างหากน้อยรุ่นสี่เหลี่ยมถดถอยสำหรับแต่ละเขตหลายระดับความแรงของหุ้นการสร้างแบบจำลองในหมู่มณฑลเพื่อให้สามารถอนุมานที่เหมาะสมมากขึ้นในมณฑลที่มีข้อมูลเล็ก ๆ น้อย ๆ
mpl.rc("font", size=12)
pgm = daft.PGM([7, 4.5], node_unit=1.2)
pgm.add_node(
    daft.Node(
        "mu_a_prior",
        r"$\mathcal{N}(0, 10^5)$",
        1,
        4,
        fixed=True,
        offset=(0, 5)))
pgm.add_node(
    daft.Node(
        "sigma_a_prior",
        r"$\mathrm{HalfCauchy}(0, 5)$",
        3,
        4,
        fixed=True,
        offset=(10, 5)))
pgm.add_node(
    daft.Node(
        "b_prior",
        r"$\mathcal{N}(0, 10^5)$",
        4,
        3.5,
        fixed=True,
        offset=(20, 5)))
pgm.add_node(daft.Node("b", r"$b$", 4, 2.5))
pgm.add_node(
    daft.Node(
        "sigma_prior",
        r"$\mathrm{HalfCauchy}(0, 5)$",
        6,
        3.5,
        fixed=True,
        offset=(20, 5)))
pgm.add_node(daft.Node("mu_a", r"$\mu_a$", 1, 3))
pgm.add_node(daft.Node("sigma_a", r"$\sigma_a$", 3, 3))
pgm.add_node(daft.Node("a", r"$a \sim \mathcal{N}$", 2, 2, scale=1.25))
pgm.add_node(daft.Node("sigma_y", r"$\sigma_y$", 6, 2.5))
pgm.add_node(
    daft.Node(
        "y_i", r"$y_i \sim \mathcal{N}$", 4, 1, scale=1.25, observed=True))
pgm.add_edge("mu_a_prior", "mu_a")
pgm.add_edge("sigma_a_prior", "sigma_a")
pgm.add_edge("mu_a", "a")
pgm.add_edge("b_prior", "b")
pgm.add_edge("sigma_a", "a")
pgm.add_edge("sigma_prior", "sigma_y")
pgm.add_edge("sigma_y", "y_i")
pgm.add_edge("a", "y_i")
pgm.add_edge("b", "y_i")
pgm.add_plate(daft.Plate([1.4, 1.2, 1.2, 1.4], "$i = 1:85$"))
pgm.add_plate(daft.Plate([3.4, 0.2, 1.2, 1.4], "$i = 1:919$"))

pgm.render()
plt.show()
def varying_intercept_model(floor, county):
  """Creates a joint distribution for the varying intercept model."""
  return tfd.JointDistributionSequential([
      tfd.Normal(loc=0., scale=1e5),    # mu_a
      tfd.HalfCauchy(loc=0., scale=5),  # sigma_a
      lambda sigma_a, mu_a: tfd.MultivariateNormalDiag(  # a
          loc=affine(tf.ones([num_counties]), mu_a[..., tf.newaxis]),
          scale_identity_multiplier=sigma_a),
      tfd.Normal(loc=0., scale=1e5),    # b
      tfd.HalfCauchy(loc=0., scale=5),  # sigma_y
      lambda sigma_y, b, a: tfd.MultivariateNormalDiag(  # y
          loc=affine(floor, b[..., tf.newaxis], tf.gather(a, county, axis=-1)),
          scale_identity_multiplier=sigma_y)
  ])


def varying_intercept_log_prob(mu_a, sigma_a, a, b, sigma_y):
  """Computes joint log prob pinned at `log_radon`."""
  return varying_intercept_model(floor, county).log_prob(
      [mu_a, sigma_a, a, b, sigma_y, log_radon])
@tf.function
def sample_varying_intercepts(num_chains, num_results, num_burnin_steps):
  """Samples from the varying intercepts model."""
  hmc = tfp.mcmc.HamiltonianMonteCarlo(
      target_log_prob_fn=varying_intercept_log_prob,
      num_leapfrog_steps=10,
      step_size=0.01)

  initial_state = [
      tf.zeros([num_chains], name='init_mu_a'),
      tf.ones([num_chains], name='init_sigma_a'),
      tf.zeros([num_chains, num_counties], name='init_a'),
      tf.zeros([num_chains], name='init_b'),
      tf.ones([num_chains], name='init_sigma_y')
  ]
  unconstraining_bijectors = [
      tfb.Identity(),  # mu_a
      tfb.Exp(),       # sigma_a
      tfb.Identity(),  # a
      tfb.Identity(),  # b
      tfb.Exp()        # sigma_y
  ]
  kernel = tfp.mcmc.TransformedTransitionKernel(
      inner_kernel=hmc, bijector=unconstraining_bijectors)
  samples, kernel_results = tfp.mcmc.sample_chain(
      num_results=num_results,
      num_burnin_steps=num_burnin_steps,
      current_state=initial_state,
      kernel=kernel)

  acceptance_probs = tf.reduce_mean(
      tf.cast(kernel_results.inner_results.is_accepted, tf.float32), axis=0)

  return samples, acceptance_probs
VaryingInterceptsModel = collections.namedtuple(
    'VaryingInterceptsModel', ['mu_a', 'sigma_a', 'a', 'b', 'sigma_y'])

samples, acceptance_probs = sample_varying_intercepts(
    num_chains=4, num_results=1000, num_burnin_steps=1000)

print('Acceptance Probabilities: ', acceptance_probs.numpy())
varying_intercepts_samples = VaryingInterceptsModel._make(samples)
Acceptance Probabilities: [0.978 0.987 0.982 0.984]
for var in ['mu_a', 'sigma_a', 'b', 'sigma_y']:
  print(
      'R-hat for ', var, ': ',
      tfp.mcmc.potential_scale_reduction(
          getattr(varying_intercepts_samples, var)).numpy())
R-hat for  mu_a :  1.1099764
R-hat for  sigma_a :  1.1058794
R-hat for  b :  1.0448593
R-hat for  sigma_y :  1.0019052
varying_intercepts_estimates = LinearEstimates(
    sample_mean(varying_intercepts_samples.a),
    sample_mean(varying_intercepts_samples.b))
sample_counties = ('Lac Qui Parle', 'Aitkin', 'Koochiching', 'Douglas', 'Clay',
                   'Stearns', 'Ramsey', 'St Louis')
plot_estimates(
    linear_estimates=[
        unpooled_estimates, pooled_estimate, varying_intercepts_estimates
    ],
    labels=['Unpooled', 'Pooled', 'Varying Intercepts'],
    sample_counties=sample_counties)
def plot_posterior(var_name, var_samples):
  if isinstance(var_samples, tf.Tensor):
    var_samples = var_samples.numpy() # convert to numpy array

  fig = plt.figure(figsize=(10, 3))
  ax = fig.add_subplot(111)
  ax.hist(var_samples.flatten(), bins=40, edgecolor='white')
  sample_mean = var_samples.mean()
  ax.text(
      sample_mean,
      100,
      'mean={:.3f}'.format(sample_mean),
      color='white',
      fontsize=12)
  ax.set_xlabel('posterior of ' + var_name)
  plt.show()


plot_posterior('b', varying_intercepts_samples.b)
plot_posterior('sigma_a', varying_intercepts_samples.sigma_a)
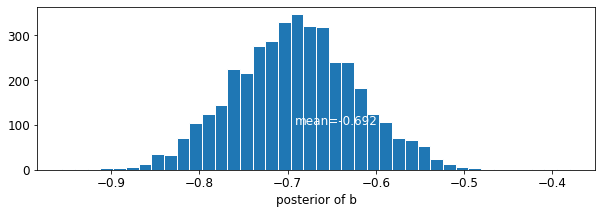
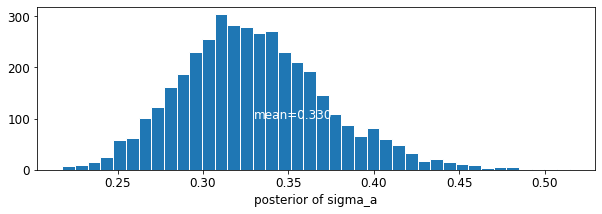
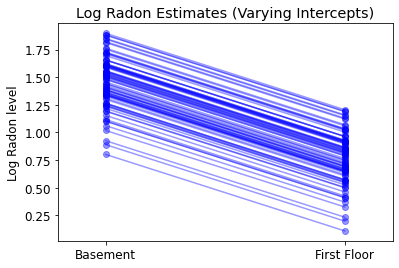
ประมาณการสำหรับค่าสัมประสิทธิ์ชั้นจะอยู่ที่ประมาณ -0.69 ซึ่งสามารถตีความได้ว่าบ้านได้โดยไม่ต้องมีชั้นใต้ดินประมาณครึ่งหนึ่ง (\(\exp(-0.69) = 0.50\)) ระดับเรดอนของผู้ที่มีชั้นใต้ดินหลังจากการบัญชีสำหรับเขต
for var in ['b']:
  var_samples = getattr(varying_intercepts_samples, var)
  mean = var_samples.numpy().mean()
  std = var_samples.numpy().std()
  r_hat = tfp.mcmc.potential_scale_reduction(var_samples).numpy()
  n_eff = tfp.mcmc.effective_sample_size(var_samples).numpy().sum()

  print('var: ', var, ' mean: ', mean, ' std: ', std, ' n_eff: ', n_eff,
        ' r_hat: ', r_hat)
var: b mean: -0.6972574 std: 0.06966117 n_eff: 397.94327 r_hat: 1.0448593
def plot_intercepts_and_slopes(linear_estimates, title):
  xvals = np.arange(2)
  intercepts = np.ones([num_counties]) * linear_estimates.intercept
  slopes = np.ones([num_counties]) * linear_estimates.slope
  fig, ax = plt.subplots()
  for c in range(num_counties):
    ax.plot(xvals, intercepts[c] + slopes[c] * xvals, 'bo-', alpha=0.4)
  plt.xlim(-0.2, 1.2)
  ax.set_xticks([0, 1])
  ax.set_xticklabels(['Basement', 'First Floor'])
  ax.set_ylabel('Log Radon level')
  plt.title(title)
  plt.show()
plot_intercepts_and_slopes(varying_intercepts_estimates,
                           'Log Radon Estimates (Varying Intercepts)')
5.3 ความลาดชันที่แตกต่างกัน
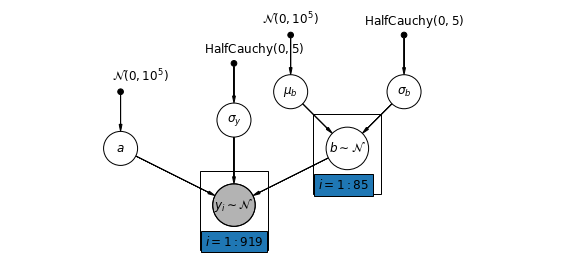
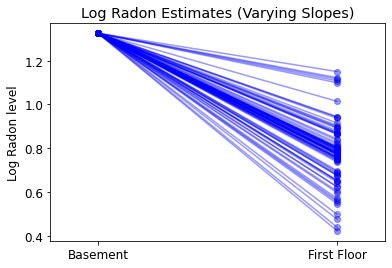
อีกทางหนึ่ง เราสามารถวางแบบจำลองที่ช่วยให้เขตต่างๆ แตกต่างกันไปตามตำแหน่งของการวัด (ชั้นใต้ดินหรือชั้นหนึ่ง) ที่ส่งผลต่อการอ่านเรดอน ในกรณีนี้ตัด \(\alpha\) ร่วมกันระหว่างมณฑล
\[y_i = \alpha + \beta_{j[i]} x_{i} + \epsilon_i\]
mpl.rc("font", size=12)
pgm = daft.PGM([10, 4.5], node_unit=1.2)
pgm.add_node(
    daft.Node(
        "mu_b_prior",
        r"$\mathcal{N}(0, 10^5)$",
        3.2,
        4,
        fixed=True,
        offset=(0, 5)))
pgm.add_node(
    daft.Node(
        "a_prior", r"$\mathcal{N}(0, 10^5)$", 2, 3, fixed=True, offset=(20, 5)))
pgm.add_node(daft.Node("a", r"$a$", 2, 2))

pgm.add_node(
    daft.Node(
        "sigma_prior",
        r"$\mathrm{HalfCauchy}(0, 5)$",
        4,
        3.5,
        fixed=True,
        offset=(20, 5)))
pgm.add_node(daft.Node("sigma_y", r"$\sigma_y$", 4, 2.5))

pgm.add_node(
    daft.Node(
        "mu_b_prior",
        r"$\mathcal{N}(0, 10^5)$",
        5,
        4,
        fixed=True,
        offset=(0, 5)))
pgm.add_node(
    daft.Node(
        "sigma_b_prior",
        r"$\mathrm{HalfCauchy}(0, 5)$",
        7,
        4,
        fixed=True,
        offset=(10, 5)))
pgm.add_node(daft.Node("mu_b", r"$\mu_b$", 5, 3))
pgm.add_node(daft.Node("sigma_b", r"$\sigma_b$", 7, 3))
pgm.add_node(daft.Node("b", r"$b \sim \mathcal{N}$", 6, 2, scale=1.25))

pgm.add_node(
    daft.Node(
        "y_i", r"$y_i \sim \mathcal{N}$", 4, 1, scale=1.25, observed=True))
pgm.add_edge("a_prior", "a")

pgm.add_edge("mu_b_prior", "mu_b")
pgm.add_edge("sigma_b_prior", "sigma_b")
pgm.add_edge("mu_b", "b")
pgm.add_edge("sigma_b", "b")

pgm.add_edge("sigma_prior", "sigma_y")

pgm.add_edge("sigma_y", "y_i")
pgm.add_edge("a", "y_i")
pgm.add_edge("b", "y_i")
pgm.add_plate(daft.Plate([5.4, 1.2, 1.2, 1.4], "$i = 1:85$"))
pgm.add_plate(daft.Plate([3.4, 0.2, 1.2, 1.4], "$i = 1:919$"))

pgm.render()
plt.show()
def varying_slopes_model(floor, county):
  """Creates a joint distribution for the varying slopes model."""
  return tfd.JointDistributionSequential([
      tfd.Normal(loc=0., scale=1e5),  # mu_b
      tfd.HalfCauchy(loc=0., scale=5),  # sigma_b
      tfd.Normal(loc=0., scale=1e5),  # a
      lambda _, sigma_b, mu_b: tfd.MultivariateNormalDiag(  # b
          loc=affine(tf.ones([num_counties]), mu_b[..., tf.newaxis]),
          scale_identity_multiplier=sigma_b),
      tfd.HalfCauchy(loc=0., scale=5),  # sigma_y
      lambda sigma_y, b, a: tfd.MultivariateNormalDiag(  # y
          loc=affine(floor, tf.gather(b, county, axis=-1), a[..., tf.newaxis]),
          scale_identity_multiplier=sigma_y)
  ])


def varying_slopes_log_prob(mu_b, sigma_b, a, b, sigma_y):
  return varying_slopes_model(floor, county).log_prob(
      [mu_b, sigma_b, a, b, sigma_y, log_radon])
@tf.function
def sample_varying_slopes(num_chains, num_results, num_burnin_steps):
  """Samples from the varying slopes model."""
  hmc = tfp.mcmc.HamiltonianMonteCarlo(
      target_log_prob_fn=varying_slopes_log_prob,
      num_leapfrog_steps=25,
      step_size=0.01)

  initial_state = [
      tf.zeros([num_chains], name='init_mu_b'),
      tf.ones([num_chains], name='init_sigma_b'),
      tf.zeros([num_chains], name='init_a'),
      tf.zeros([num_chains, num_counties], name='init_b'),
      tf.ones([num_chains], name='init_sigma_y')
  ]
  unconstraining_bijectors = [
      tfb.Identity(),  # mu_b
      tfb.Exp(),       # sigma_b
      tfb.Identity(),  # a
      tfb.Identity(),  # b
      tfb.Exp()        # sigma_y
  ]
  kernel = tfp.mcmc.TransformedTransitionKernel(
      inner_kernel=hmc, bijector=unconstraining_bijectors)
  samples, kernel_results = tfp.mcmc.sample_chain(
      num_results=num_results,
      num_burnin_steps=num_burnin_steps,
      current_state=initial_state,
      kernel=kernel)

  acceptance_probs = tf.reduce_mean(
      tf.cast(kernel_results.inner_results.is_accepted, tf.float32), axis=0)

  return samples, acceptance_probs
VaryingSlopesModel = collections.namedtuple(
    'VaryingSlopesModel', ['mu_b', 'sigma_b', 'a', 'b', 'sigma_y'])

samples, acceptance_probs = sample_varying_slopes(
    num_chains=4, num_results=1000, num_burnin_steps=1000)

print('Acceptance Probabilities: ', acceptance_probs.numpy())
varying_slopes_samples = VaryingSlopesModel._make(samples)
Acceptance Probabilities: [0.979 0.984 0.977 0.984]
for var in ['mu_b', 'sigma_b', 'a', 'sigma_y']:
  print(
      'R-hat for ', var, '\t: ',
      tfp.mcmc.potential_scale_reduction(getattr(varying_slopes_samples,
                                                 var)).numpy())
R-hat for  mu_b     :  1.0770341
R-hat for  sigma_b  :  1.0634488
R-hat for  a    :  1.0133665
R-hat for  sigma_y  :  1.0011941
varying_slopes_estimates = LinearEstimates(
    sample_mean(varying_slopes_samples.a),
    sample_mean(varying_slopes_samples.b))

plot_intercepts_and_slopes(varying_slopes_estimates,
                           'Log Radon Estimates (Varying Slopes)')
5.4 การสกัดกั้นและความลาดชันที่แตกต่างกัน
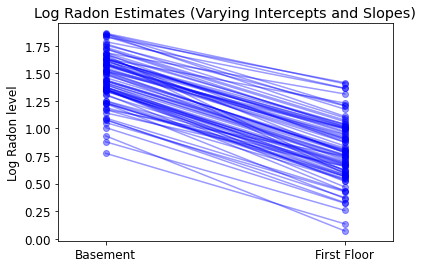
โมเดลทั่วไปส่วนใหญ่ยอมให้ทั้งการสกัดกั้นและความชันแตกต่างกันไปตามเขต:
\[y_i = \alpha_{j[i]} + \beta_{j[i]} x_{i} + \epsilon_i\]
mpl.rc("font", size=12)
pgm = daft.PGM([10, 4.5], node_unit=1.2)
pgm.add_node(
    daft.Node(
        "mu_a_prior",
        r"$\mathcal{N}(0, 10^5)$",
        1,
        4,
        fixed=True,
        offset=(0, 5)))
pgm.add_node(
    daft.Node(
        "sigma_a_prior",
        r"$\mathrm{HalfCauchy}(0, 5)$",
        3,
        4,
        fixed=True,
        offset=(10, 5)))
pgm.add_node(daft.Node("mu_a", r"$\mu_a$", 1, 3))
pgm.add_node(daft.Node("sigma_a", r"$\sigma_a$", 3, 3))
pgm.add_node(daft.Node("a", r"$a \sim \mathcal{N}$", 2, 2, scale=1.25))

pgm.add_node(
    daft.Node(
        "sigma_prior",
        r"$\mathrm{HalfCauchy}(0, 5)$",
        4,
        3.5,
        fixed=True,
        offset=(20, 5)))
pgm.add_node(daft.Node("sigma_y", r"$\sigma_y$", 4, 2.5))

pgm.add_node(
    daft.Node(
        "mu_b_prior",
        r"$\mathcal{N}(0, 10^5)$",
        5,
        4,
        fixed=True,
        offset=(0, 5)))
pgm.add_node(
    daft.Node(
        "sigma_b_prior",
        r"$\mathrm{HalfCauchy}(0, 5)$",
        7,
        4,
        fixed=True,
        offset=(10, 5)))
pgm.add_node(daft.Node("mu_b", r"$\mu_b$", 5, 3))
pgm.add_node(daft.Node("sigma_b", r"$\sigma_b$", 7, 3))
pgm.add_node(daft.Node("b", r"$b \sim \mathcal{N}$", 6, 2, scale=1.25))

pgm.add_node(
    daft.Node(
        "y_i", r"$y_i \sim \mathcal{N}$", 4, 1, scale=1.25, observed=True))
pgm.add_edge("mu_a_prior", "mu_a")
pgm.add_edge("sigma_a_prior", "sigma_a")
pgm.add_edge("mu_a", "a")
pgm.add_edge("sigma_a", "a")

pgm.add_edge("mu_b_prior", "mu_b")
pgm.add_edge("sigma_b_prior", "sigma_b")
pgm.add_edge("mu_b", "b")
pgm.add_edge("sigma_b", "b")

pgm.add_edge("sigma_prior", "sigma_y")

pgm.add_edge("sigma_y", "y_i")
pgm.add_edge("a", "y_i")
pgm.add_edge("b", "y_i")
pgm.add_plate(daft.Plate([1.4, 1.2, 1.2, 1.4], "$i = 1:85$"))
pgm.add_plate(daft.Plate([5.4, 1.2, 1.2, 1.4], "$i = 1:85$"))
pgm.add_plate(daft.Plate([3.4, 0.2, 1.2, 1.4], "$i = 1:919$"))

pgm.render()
plt.show()
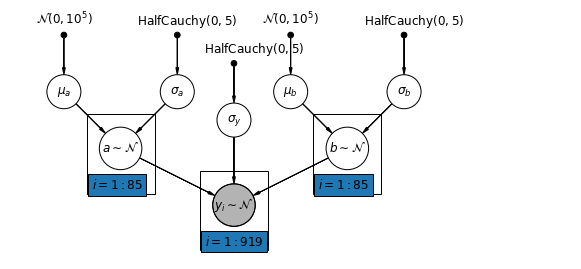
def varying_intercepts_and_slopes_model(floor, county):
  """Creates a joint distribution for the varying slope model."""
  return tfd.JointDistributionSequential([
      tfd.Normal(loc=0., scale=1e5),    # mu_a
      tfd.HalfCauchy(loc=0., scale=5),  # sigma_a
      tfd.Normal(loc=0., scale=1e5),    # mu_b
      tfd.HalfCauchy(loc=0., scale=5),  # sigma_b
      lambda sigma_b, mu_b, sigma_a, mu_a: tfd.MultivariateNormalDiag(  # a
          loc=affine(tf.ones([num_counties]), mu_a[..., tf.newaxis]),
          scale_identity_multiplier=sigma_a),
      lambda _, sigma_b, mu_b: tfd.MultivariateNormalDiag(  # b
          loc=affine(tf.ones([num_counties]), mu_b[..., tf.newaxis]),
          scale_identity_multiplier=sigma_b),
      tfd.HalfCauchy(loc=0., scale=5),  # sigma_y
      lambda sigma_y, b, a: tfd.MultivariateNormalDiag(  # y
          loc=affine(floor, tf.gather(b, county, axis=-1),
                     tf.gather(a, county, axis=-1)),
          scale_identity_multiplier=sigma_y)
  ])


@tf.function
def varying_intercepts_and_slopes_log_prob(mu_a, sigma_a, mu_b, sigma_b, a, b,
                                           sigma_y):
  """Computes joint log prob pinned at `log_radon`."""
  return varying_intercepts_and_slopes_model(floor, county).log_prob(
      [mu_a, sigma_a, mu_b, sigma_b, a, b, sigma_y, log_radon])
@tf.function
def sample_varying_intercepts_and_slopes(num_chains, num_results,
                                         num_burnin_steps):
  """Samples from the varying intercepts and slopes model."""
  hmc = tfp.mcmc.HamiltonianMonteCarlo(
      target_log_prob_fn=varying_intercepts_and_slopes_log_prob,
      num_leapfrog_steps=50,
      step_size=0.01)

  initial_state = [
      tf.zeros([num_chains], name='init_mu_a'),
      tf.ones([num_chains], name='init_sigma_a'),
      tf.zeros([num_chains], name='init_mu_b'),
      tf.ones([num_chains], name='init_sigma_b'),
      tf.zeros([num_chains, num_counties], name='init_a'),
      tf.zeros([num_chains, num_counties], name='init_b'),
      tf.ones([num_chains], name='init_sigma_y')
  ]
  unconstraining_bijectors = [
      tfb.Identity(),  # mu_a
      tfb.Exp(),       # sigma_a
      tfb.Identity(),  # mu_b
      tfb.Exp(),       # sigma_b
      tfb.Identity(),  # a
      tfb.Identity(),  # b
      tfb.Exp()        # sigma_y
  ]
  kernel = tfp.mcmc.TransformedTransitionKernel(
      inner_kernel=hmc, bijector=unconstraining_bijectors)
  samples, kernel_results = tfp.mcmc.sample_chain(
      num_results=num_results,
      num_burnin_steps=num_burnin_steps,
      current_state=initial_state,
      kernel=kernel)

  acceptance_probs = tf.reduce_mean(
      tf.cast(kernel_results.inner_results.is_accepted, tf.float32), axis=0)

  return samples, acceptance_probs
VaryingInterceptsAndSlopesModel = collections.namedtuple(
    'VaryingInterceptsAndSlopesModel',
    ['mu_a', 'sigma_a', 'mu_b', 'sigma_b', 'a', 'b', 'sigma_y'])

samples, acceptance_probs = sample_varying_intercepts_and_slopes(
    num_chains=4, num_results=1000, num_burnin_steps=500)

print('Acceptance Probabilities: ', acceptance_probs.numpy())
varying_intercepts_and_slopes_samples = VaryingInterceptsAndSlopesModel._make(
    samples)
Acceptance Probabilities: [0.988 0.985 0.992 0.938]
for var in ['mu_a', 'sigma_a', 'mu_b', 'sigma_b']:
  print(
      'R-hat for ', var, '\t: ',
      tfp.mcmc.potential_scale_reduction(
          getattr(varying_intercepts_and_slopes_samples, var)).numpy())
R-hat for  mu_a     :  1.010764
R-hat for  sigma_a  :  1.0078123
R-hat for  mu_b     :  1.0279609
R-hat for  sigma_b  :  1.3165458
varying_intercepts_and_slopes_estimates = LinearEstimates(
    sample_mean(varying_intercepts_and_slopes_samples.a),
    sample_mean(varying_intercepts_and_slopes_samples.b))

plot_intercepts_and_slopes(
    varying_intercepts_and_slopes_estimates,
    'Log Radon Estimates (Varying Intercepts and Slopes)')
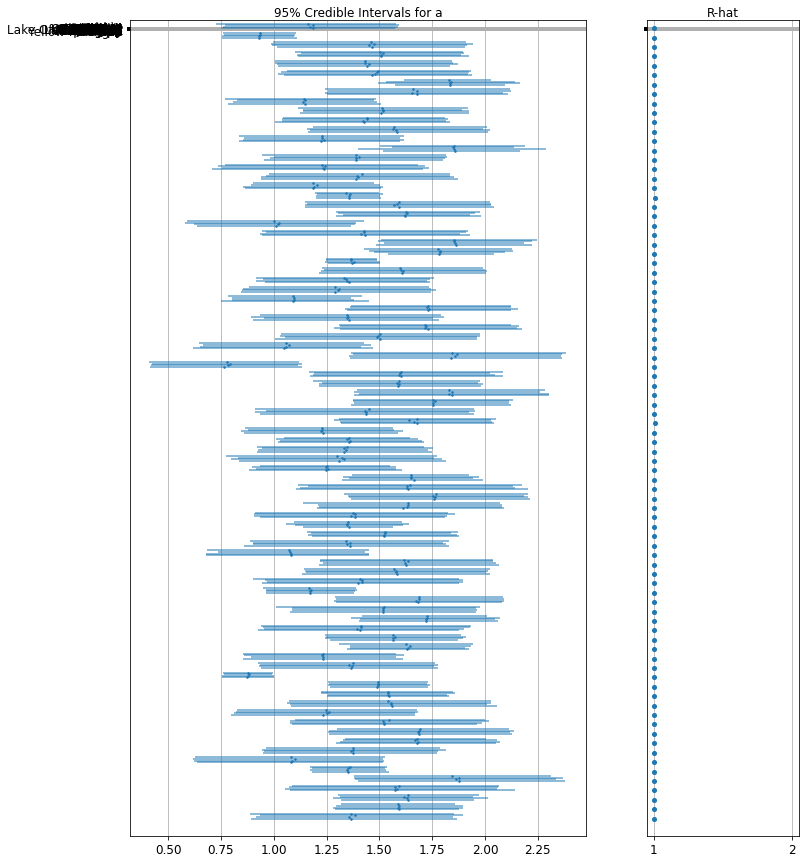
forest_plot(
    num_chains=4,
    num_vars=num_counties,
    var_name='a',
    var_labels=county_name,
    samples=varying_intercepts_and_slopes_samples.a.numpy())
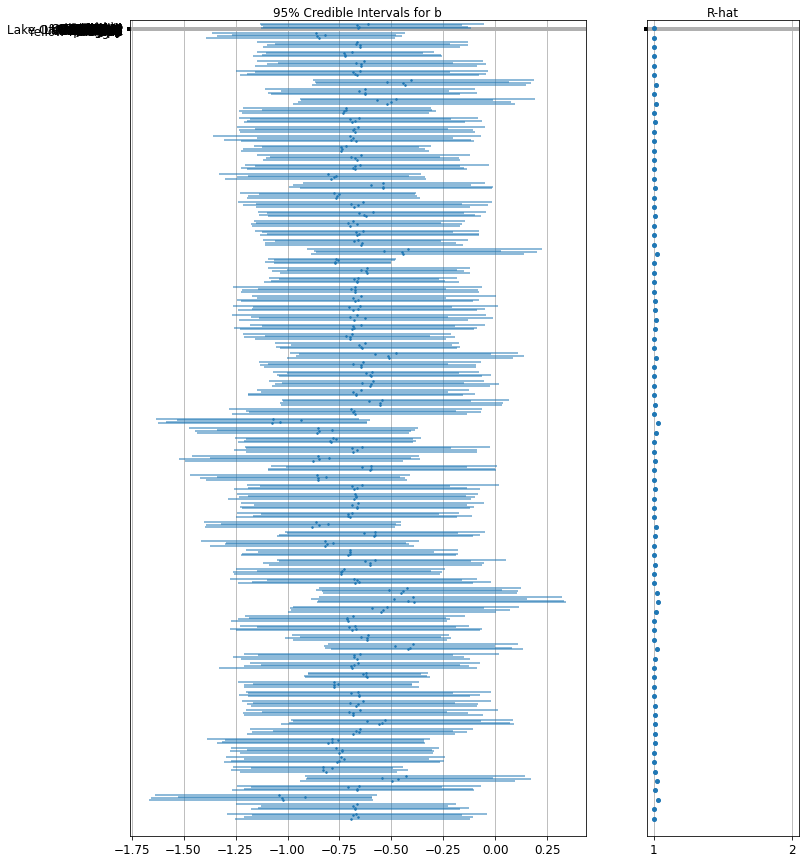
forest_plot(
    num_chains=4,
    num_vars=num_counties,
    var_name='b',
    var_labels=county_name,
    samples=varying_intercepts_and_slopes_samples.b.numpy())
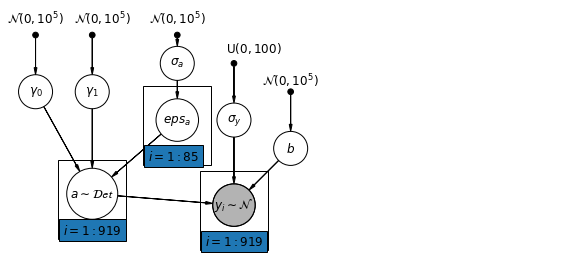
6 การเพิ่มตัวทำนายระดับกลุ่ม
จุดแข็งหลักของโมเดลหลายระดับคือความสามารถในการจัดการกับตัวทำนายในหลายระดับพร้อมกัน หากเราพิจารณารูปแบบการสกัดกั้นที่แตกต่างกันด้านบน:
\(y_i = \alpha_{j[i]} + \beta x_{i} + \epsilon_i\) เราอาจแทนของผลการสุ่มอย่างง่ายที่จะอธิบายการเปลี่ยนแปลงในมูลค่าที่คาดว่าเรดอนระบุถดถอยแบบอื่นที่มีตัวแปรร่วมระดับเขต ที่นี่เราใช้ยูเรเนียมเขตอ่าน \(u_j\)ซึ่งคิดว่าจะเกี่ยวข้องกับระดับเรดอน:
\(\alpha_j = \gamma_0 + \gamma_1 u_j + \zeta_j\)\(\zeta_j \sim N(0, \sigma_{\alpha}^2)\) ดังนั้นตอนนี้เรากำลังใช้มาตรการทำนายบ้านระดับ (ชั้นหรือชั้นใต้ดิน) เช่นเดียวกับการทำนายระดับเขต (ยูเรเนียม)
โปรดทราบว่าโมเดลมีตัวแปรตัวบ่งชี้ทั้งสองแบบสำหรับแต่ละเคาน์ตี บวกกับตัวแปรร่วมระดับเคาน์ตี ในการถดถอยแบบคลาสสิก นี้จะส่งผลให้เกิด collinearity ในแบบจำลองหลายระดับ การรวมกันบางส่วนของการสกัดกั้นไปยังค่าที่คาดหวังของแบบจำลองเชิงเส้นระดับกลุ่มจะหลีกเลี่ยงสิ่งนี้
พยากรณ์ระดับกลุ่มยังทำหน้าที่ในการลดการเปลี่ยนแปลงระดับกลุ่ม\(\sigma_{\alpha}\)ความหมายที่สำคัญของสิ่งนี้คือ การประมาณการระดับกลุ่มทำให้เกิดการรวมกลุ่มที่แข็งแกร่งขึ้น
6.1 โมเดลการสกัดกั้นแบบลำดับชั้น
mpl.rc("font", size=12)
pgm = daft.PGM([10, 4.5], node_unit=1.2)
pgm.add_node(
    daft.Node(
        "gamma_0_prior",
        r"$\mathcal{N}(0, 10^5)$",
        0.5,
        4,
        fixed=True,
        offset=(0, 5)))
pgm.add_node(
    daft.Node(
        "gamma_1_prior",
        r"$\mathcal{N}(0, 10^5)$",
        1.5,
        4,
        fixed=True,
        offset=(10, 5)))
pgm.add_node(daft.Node("gamma_0", r"$\gamma_0$", 0.5, 3))
pgm.add_node(daft.Node("gamma_1", r"$\gamma_1$", 1.5, 3))
pgm.add_node(
    daft.Node(
        "sigma_a_prior",
        r"$\mathcal{N}(0, 10^5)$",
        3,
        4,
        fixed=True,
        offset=(0, 5)))
pgm.add_node(daft.Node("sigma_a", r"$\sigma_a$", 3, 3.5))
pgm.add_node(daft.Node("eps_a", r"$eps_a$", 3, 2.5, scale=1.25))
pgm.add_node(daft.Node("a", r"$a \sim \mathcal{Det}$", 1.5, 1.2, scale=1.5))

pgm.add_node(
    daft.Node(
        "sigma_prior",
        r"$\mathrm{U}(0, 100)$",
        4,
        3.5,
        fixed=True,
        offset=(20, 5)))
pgm.add_node(daft.Node("sigma_y", r"$\sigma_y$", 4, 2.5))
pgm.add_node(daft.Node("b_prior", r"$\mathcal{N}(0, 10^5)$", 5, 3, fixed=True))
pgm.add_node(daft.Node("b", r"$b$", 5, 2))

pgm.add_node(
    daft.Node(
        "y_i", r"$y_i \sim \mathcal{N}$", 4, 1, scale=1.25, observed=True))

pgm.add_edge("gamma_0_prior", "gamma_0")
pgm.add_edge("gamma_1_prior", "gamma_1")
pgm.add_edge("sigma_a_prior", "sigma_a")
pgm.add_edge("sigma_a", "eps_a")
pgm.add_edge("gamma_0", "a")
pgm.add_edge("gamma_1", "a")
pgm.add_edge("eps_a", "a")

pgm.add_edge("b_prior", "b")
pgm.add_edge("sigma_prior", "sigma_y")

pgm.add_edge("sigma_y", "y_i")
pgm.add_edge("a", "y_i")
pgm.add_edge("b", "y_i")
pgm.add_plate(daft.Plate([2.4, 1.7, 1.2, 1.4], "$i = 1:85$"))
pgm.add_plate(daft.Plate([0.9, 0.4, 1.2, 1.4], "$i = 1:919$"))
pgm.add_plate(daft.Plate([3.4, 0.2, 1.2, 1.4], "$i = 1:919$"))

pgm.render()
plt.show()
def hierarchical_intercepts_model(floor, county, log_uranium):
  """Creates a joint distribution for the varying slope model."""
  return tfd.JointDistributionSequential([
      tfd.HalfCauchy(loc=0., scale=5),  # sigma_a
      lambda sigma_a: tfd.MultivariateNormalDiag(  # eps_a
          loc=tf.zeros([num_counties]),
          scale_identity_multiplier=sigma_a),
      tfd.Normal(loc=0., scale=1e5),  # gamma_0
      tfd.Normal(loc=0., scale=1e5),  # gamma_1
      tfd.Normal(loc=0., scale=1e5),  # b
      tfd.Uniform(low=0., high=100),  # sigma_y
      lambda sigma_y, b, gamma_1, gamma_0, eps_a: tfd.
      MultivariateNormalDiag(  # y
          loc=affine(
              floor, b[..., tf.newaxis],
              affine(log_uranium, gamma_1[..., tf.newaxis],
                     gamma_0[..., tf.newaxis]) + tf.gather(eps_a, county, axis=-1)),
          scale_identity_multiplier=sigma_y)
  ])


def hierarchical_intercepts_log_prob(sigma_a, eps_a, gamma_0, gamma_1, b,
                                     sigma_y):
  """Computes joint log prob pinned at `log_radon`."""
  return hierarchical_intercepts_model(floor, county, log_uranium).log_prob(
      [sigma_a, eps_a, gamma_0, gamma_1, b, sigma_y, log_radon])
@tf.function
def sample_hierarchical_intercepts(num_chains, num_results, num_burnin_steps):
  """Samples from the hierarchical intercepts model."""
  hmc = tfp.mcmc.HamiltonianMonteCarlo(
      target_log_prob_fn=hierarchical_intercepts_log_prob,
      num_leapfrog_steps=10,
      step_size=0.01)

  initial_state = [
      tf.ones([num_chains], name='init_sigma_a'),
      tf.zeros([num_chains, num_counties], name='eps_a'),
      tf.zeros([num_chains], name='init_gamma_0'),
      tf.zeros([num_chains], name='init_gamma_1'),
      tf.zeros([num_chains], name='init_b'),
      tf.ones([num_chains], name='init_sigma_y')
  ]
  unconstraining_bijectors = [
      tfb.Exp(),       # sigma_a
      tfb.Identity(),  # eps_a
      tfb.Identity(),  # gamma_0
      tfb.Identity(),  # gamma_0
      tfb.Identity(),  # b
      # Maps reals to [0, 100].
      tfb.Chain([tfb.Shift(shift=50.),
                 tfb.Scale(scale=50.),
                 tfb.Tanh()])  # sigma_y
  ]
  kernel = tfp.mcmc.TransformedTransitionKernel(
      inner_kernel=hmc, bijector=unconstraining_bijectors)
  samples, kernel_results = tfp.mcmc.sample_chain(
      num_results=num_results,
      num_burnin_steps=num_burnin_steps,
      current_state=initial_state,
      kernel=kernel)

  acceptance_probs = tf.reduce_mean(
      tf.cast(kernel_results.inner_results.is_accepted, tf.float32), axis=0)

  return samples, acceptance_probs
HierarchicalInterceptsModel = collections.namedtuple(
    'HierarchicalInterceptsModel',
    ['sigma_a', 'eps_a', 'gamma_0', 'gamma_1', 'b', 'sigma_y'])

samples, acceptance_probs = sample_hierarchical_intercepts(
    num_chains=4, num_results=2000, num_burnin_steps=500)
print('Acceptance Probabilities: ', acceptance_probs.numpy())
hierarchical_intercepts_samples = HierarchicalInterceptsModel._make(samples)
Acceptance Probabilities: [0.9615 0.941 0.955 0.95 ]
for var in ['sigma_a', 'gamma_0', 'gamma_1', 'b', 'sigma_y']:
  print(
      'R-hat for', var, ':',
      tfp.mcmc.potential_scale_reduction(
          getattr(hierarchical_intercepts_samples, var)).numpy())
R-hat for sigma_a : 1.0469627
R-hat for gamma_0 : 1.0016835
R-hat for gamma_1 : 1.0097923
R-hat for b : 1.0014259
R-hat for sigma_y : 1.0025403
def plot_hierarchical_intercepts():
  mean_and_var = lambda x : [reduce_samples(x, fn) for fn in [np.mean, np.var]]
  gamma_0_mean, gamma_0_var = mean_and_var(
    hierarchical_intercepts_samples.gamma_0)
  gamma_1_mean, gamma_1_var = mean_and_var(
    hierarchical_intercepts_samples.gamma_1)
  eps_a_means, eps_a_vars  = mean_and_var(hierarchical_intercepts_samples.eps_a)

  mu_a_means = gamma_0_mean + gamma_1_mean * log_uranium
  mu_a_vars = gamma_0_var + np.square(log_uranium) * gamma_1_var
  a_means = mu_a_means + eps_a_means[county]
  a_stds = np.sqrt(mu_a_vars + eps_a_vars[county])

  plt.figure()
  plt.scatter(log_uranium, a_means, marker='.', c='C0')
  xvals = np.linspace(-1, 0.8)
  plt.plot(xvals,gamma_0_mean + gamma_1_mean * xvals, 'k--')
  plt.xlim(-1, 0.8)

  for ui, m, se in zip(log_uranium, a_means, a_stds):
    plt.plot([ui, ui], [m - se, m + se], 'C1-', alpha=0.1)
  plt.xlabel('County-level uranium')
  plt.ylabel('Intercept estimate')


plot_hierarchical_intercepts()
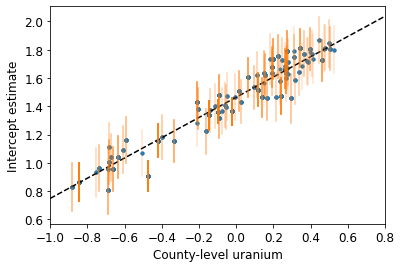
ข้อผิดพลาดมาตรฐานในการสกัดกั้นจะแคบกว่าสำหรับแบบจำลองการรวมบางส่วนโดยไม่มีตัวแปรร่วมระดับเคาน์ตี
6.2 ความสัมพันธ์ระหว่างระดับ
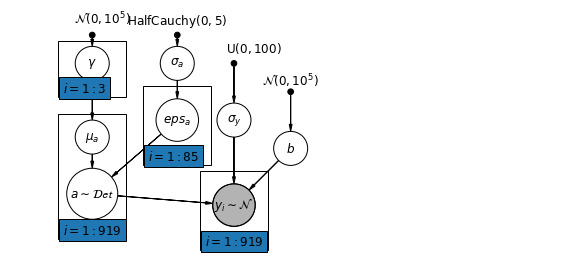
ในบางกรณี การมีตัวทำนายหลายระดับสามารถเปิดเผยความสัมพันธ์ระหว่างตัวแปรระดับบุคคลกับค่าคงเหลือของกลุ่ม เราสามารถอธิบายได้โดยการรวมค่าเฉลี่ยของตัวทำนายแต่ละตัวเป็นตัวแปรร่วมในแบบจำลองสำหรับการสกัดกั้นแบบกลุ่ม
\(\alpha_j = \gamma_0 + \gamma_1 u_j + \gamma_2 \bar{x} + \zeta_j\) เหล่านี้จะกว้างเรียกว่าผลกระทบที่ตามบริบท
mpl.rc("font", size=12)
pgm = daft.PGM([10, 4.5], node_unit=1.2)
pgm.add_node(
    daft.Node(
        "gamma_prior",
        r"$\mathcal{N}(0, 10^5)$",
        1.5,
        4,
        fixed=True,
        offset=(10, 5)))
pgm.add_node(daft.Node("gamma", r"$\gamma$", 1.5, 3.5))
pgm.add_node(daft.Node("mu_a", r"$\mu_a$", 1.5, 2.2))
pgm.add_node(
    daft.Node(
        "sigma_a_prior",
        r"$\mathrm{HalfCauchy}(0, 5)$",
        3,
        4,
        fixed=True,
        offset=(0, 5)))
pgm.add_node(daft.Node("sigma_a", r"$\sigma_a$", 3, 3.5))
pgm.add_node(daft.Node("eps_a", r"$eps_a$", 3, 2.5, scale=1.25))
pgm.add_node(daft.Node("a", r"$a \sim \mathcal{Det}$", 1.5, 1.2, scale=1.5))

pgm.add_node(
    daft.Node(
        "sigma_prior",
        r"$\mathrm{U}(0, 100)$",
        4,
        3.5,
        fixed=True,
        offset=(20, 5)))
pgm.add_node(daft.Node("sigma_y", r"$\sigma_y$", 4, 2.5))
pgm.add_node(daft.Node("b_prior", r"$\mathcal{N}(0, 10^5)$", 5, 3, fixed=True))
pgm.add_node(daft.Node("b", r"$b$", 5, 2))

pgm.add_node(
    daft.Node(
        "y_i", r"$y_i \sim \mathcal{N}$", 4, 1, scale=1.25, observed=True))

pgm.add_edge("gamma_prior", "gamma")
pgm.add_edge("sigma_a_prior", "sigma_a")
pgm.add_edge("sigma_a", "eps_a")
pgm.add_edge("gamma", "mu_a")
pgm.add_edge("mu_a", "a")
pgm.add_edge("eps_a", "a")

pgm.add_edge("b_prior", "b")
pgm.add_edge("sigma_prior", "sigma_y")

pgm.add_edge("sigma_y", "y_i")
pgm.add_edge("a", "y_i")
pgm.add_edge("b", "y_i")
pgm.add_plate(daft.Plate([0.9, 2.9, 1.2, 1.0], "$i = 1:3$"))
pgm.add_plate(daft.Plate([2.4, 1.7, 1.2, 1.4], "$i = 1:85$"))
pgm.add_plate(daft.Plate([0.9, 0.4, 1.2, 2.2], "$i = 1:919$"))
pgm.add_plate(daft.Plate([3.4, 0.2, 1.2, 1.4], "$i = 1:919$"))

pgm.render()
plt.show()
# Create a new variable for mean of floor across counties
xbar = tf.convert_to_tensor(radon.groupby('county')['floor'].mean(), tf.float32)
xbar = tf.gather(xbar, county, axis=-1)
def contextual_effects_model(floor, county, log_uranium, xbar):
  """Creates a joint distribution for the varying slope model."""
  return tfd.JointDistributionSequential([
      tfd.HalfCauchy(loc=0., scale=5),  # sigma_a
      lambda sigma_a: tfd.MultivariateNormalDiag(  # eps_a
          loc=tf.zeros([num_counties]),
          scale_identity_multiplier=sigma_a),
      tfd.Normal(loc=0., scale=1e5),  # gamma_0
      tfd.Normal(loc=0., scale=1e5),  # gamma_1
      tfd.Normal(loc=0., scale=1e5),  # gamma_2
      tfd.Normal(loc=0., scale=1e5),  # b
      tfd.Uniform(low=0., high=100),  # sigma_y
      lambda sigma_y, b, gamma_2, gamma_1, gamma_0, eps_a: tfd.
      MultivariateNormalDiag(  # y
          loc=affine(
              floor, b[..., tf.newaxis],
              affine(log_uranium, gamma_1[..., tf.newaxis], gamma_0[
                  ..., tf.newaxis]) + affine(xbar, gamma_2[..., tf.newaxis]) +
              tf.gather(eps_a, county, axis=-1)),
          scale_identity_multiplier=sigma_y)
  ])


def contextual_effects_log_prob(sigma_a, eps_a, gamma_0, gamma_1, gamma_2, b,
                                sigma_y):
  """Computes joint log prob pinned at `log_radon`."""
  return contextual_effects_model(floor, county, log_uranium, xbar).log_prob(
      [sigma_a, eps_a, gamma_0, gamma_1, gamma_2, b, sigma_y, log_radon])
@tf.function
def sample_contextual_effects(num_chains, num_results, num_burnin_steps):
  """Samples from the hierarchical intercepts model."""
  hmc = tfp.mcmc.HamiltonianMonteCarlo(
      target_log_prob_fn=contextual_effects_log_prob,
      num_leapfrog_steps=10,
      step_size=0.01)

  initial_state = [
      tf.ones([num_chains], name='init_sigma_a'),
      tf.zeros([num_chains, num_counties], name='eps_a'),
      tf.zeros([num_chains], name='init_gamma_0'),
      tf.zeros([num_chains], name='init_gamma_1'),
      tf.zeros([num_chains], name='init_gamma_2'),
      tf.zeros([num_chains], name='init_b'),
      tf.ones([num_chains], name='init_sigma_y')
  ]
  unconstraining_bijectors = [
      tfb.Exp(),       # sigma_a
      tfb.Identity(),  # eps_a
      tfb.Identity(),  # gamma_0
      tfb.Identity(),  # gamma_1
      tfb.Identity(),  # gamma_2
      tfb.Identity(),  # b
      tfb.Chain([tfb.Shift(shift=50.),
                 tfb.Scale(scale=50.),
                 tfb.Tanh()])  # sigma_y
  ]
  kernel = tfp.mcmc.TransformedTransitionKernel(
      inner_kernel=hmc, bijector=unconstraining_bijectors)
  samples, kernel_results = tfp.mcmc.sample_chain(
      num_results=num_results,
      num_burnin_steps=num_burnin_steps,
      current_state=initial_state,
      kernel=kernel)

  acceptance_probs = tf.reduce_mean(
      tf.cast(kernel_results.inner_results.is_accepted, tf.float32), axis=0)

  return samples, acceptance_probs
ContextualEffectsModel = collections.namedtuple(
    'ContextualEffectsModel',
    ['sigma_a', 'eps_a', 'gamma_0', 'gamma_1', 'gamma_2', 'b', 'sigma_y'])

samples, acceptance_probs = sample_contextual_effects(
    num_chains=4, num_results=2000, num_burnin_steps=500)
print('Acceptance Probabilities: ', acceptance_probs.numpy())
contextual_effects_samples = ContextualEffectsModel._make(samples)
Acceptance Probabilities: [0.9505 0.9595 0.951 0.9535]
for var in ['sigma_a', 'gamma_0', 'gamma_1', 'gamma_2', 'b', 'sigma_y']:
  print(
      'R-hat for ', var, ': ',
      tfp.mcmc.potential_scale_reduction(
          getattr(contextual_effects_samples, var)).numpy())
R-hat for  sigma_a :  1.0709597
R-hat for  gamma_0 :  1.0067923
R-hat for  gamma_1 :  1.0089629
R-hat for  gamma_2 :  1.0054177
R-hat for  b :  1.0018929
R-hat for  sigma_y :  1.0032713
for var in ['gamma_0', 'gamma_1', 'gamma_2']:
  var_samples = getattr(contextual_effects_samples, var)
  mean = var_samples.numpy().mean()
  std = var_samples.numpy().std()
  r_hat = tfp.mcmc.potential_scale_reduction(var_samples).numpy()
  n_eff = tfp.mcmc.effective_sample_size(var_samples).numpy().sum()

  print(var, ' mean: ', mean, ' std: ', std, ' n_eff: ', n_eff, ' r_hat: ',
        r_hat)
gamma_0  mean:  1.3934746  std:  0.04966602  n_eff:  816.21265  r_hat:  1.0067923
gamma_1  mean:  0.7229424  std:  0.088611916  n_eff:  1462.486  r_hat:  1.0089629
gamma_2  mean:  0.40893936  std:  0.20304097  n_eff:  457.8165  r_hat:  1.0054177
ดังนั้น เราอาจอนุมานได้จากสิ่งนี้ว่าเคาน์ตีที่มีสัดส่วนบ้านสูงกว่าโดยไม่มีชั้นใต้ดินมักจะมีระดับเรดอนที่สูงกว่า บางทีนี่อาจเกี่ยวข้องกับชนิดของดิน ซึ่งอาจส่งผลต่อประเภทของโครงสร้างที่สร้างขึ้น
6.3 การทำนาย
Gelman (2006) ใช้การทดสอบ cross-validation เพื่อตรวจสอบข้อผิดพลาดในการคาดคะเนของโมเดลแบบ unpooled, pooled และ partly-pooled
ข้อผิดพลาดในการคาดคะเนข้ามการตรวจสอบค่าเฉลี่ยกำลังสอง:
- ไม่พูล = 0.86
- รวมกัน = 0.84
- หลายระดับ = 0.79
การทำนายมีสองประเภทที่สามารถทำได้ในแบบจำลองหลายระดับ:
- บุคคลใหม่ภายในกลุ่มที่มีอยู่
- บุคคลใหม่ภายในกลุ่มใหม่
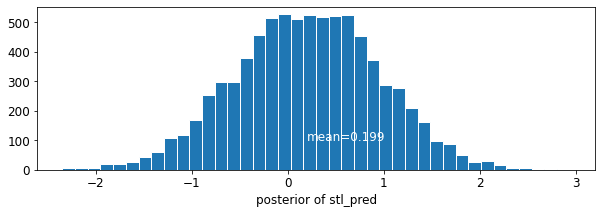
ตัวอย่างเช่น หากเราต้องการทำนายบ้านใหม่ที่ไม่มีห้องใต้ดินในเขตเซนต์หลุยส์ เราแค่ต้องสุ่มตัวอย่างจากแบบจำลองเรดอนด้วยการสกัดกั้นที่เหมาะสม
county_name.index('St Louis')
69
นั่นคือ,
\[\tilde{y}_i \sim N(\alpha_{69} + \beta (x_i=1), \sigma_y^2)\]
st_louis_log_uranium = tf.convert_to_tensor(
    radon.where(radon['county'] == 69)['log_uranium_ppm'].mean(), tf.float32)
st_louis_xbar = tf.convert_to_tensor(
    radon.where(radon['county'] == 69)['floor'].mean(), tf.float32)
@tf.function
def intercept_a(gamma_0, gamma_1, gamma_2, eps_a, log_uranium, xbar, county):
  return (affine(log_uranium, gamma_1, gamma_0) + affine(xbar, gamma_2) +
          tf.gather(eps_a, county, axis=-1))


def contextual_effects_predictive_model(floor, county, log_uranium, xbar,
                                        st_louis_log_uranium, st_louis_xbar):
  """Creates a joint distribution for the contextual effects model."""
  return tfd.JointDistributionSequential([
      tfd.HalfCauchy(loc=0., scale=5),  # sigma_a
      lambda sigma_a: tfd.MultivariateNormalDiag(  # eps_a
          loc=tf.zeros([num_counties]),
          scale_identity_multiplier=sigma_a),
      tfd.Normal(loc=0., scale=1e5),  # gamma_0
      tfd.Normal(loc=0., scale=1e5),  # gamma_1
      tfd.Normal(loc=0., scale=1e5),  # gamma_2
      tfd.Normal(loc=0., scale=1e5),  # b
      tfd.Uniform(low=0., high=100),  # sigma_y
      # y
      lambda sigma_y, b, gamma_2, gamma_1, gamma_0, eps_a: (
        tfd.MultivariateNormalDiag(
          loc=affine(
              floor, b[..., tf.newaxis],
              intercept_a(gamma_0[..., tf.newaxis],
                          gamma_1[..., tf.newaxis], gamma_2[..., tf.newaxis],
                          eps_a, log_uranium, xbar, county)),
          scale_identity_multiplier=sigma_y)),
      # stl_pred
      lambda _, sigma_y, b, gamma_2, gamma_1, gamma_0, eps_a: tfd.Normal(
          loc=intercept_a(gamma_0, gamma_1, gamma_2, eps_a,
                          st_louis_log_uranium, st_louis_xbar, 69) + b,
          scale=sigma_y)
  ])


@tf.function
def contextual_effects_predictive_log_prob(sigma_a, eps_a, gamma_0, gamma_1,
                                           gamma_2, b, sigma_y, stl_pred):
  """Computes joint log prob pinned at `log_radon`."""
  return contextual_effects_predictive_model(floor, county, log_uranium, xbar,
                                             st_louis_log_uranium,
                                             st_louis_xbar).log_prob([
                                                 sigma_a, eps_a, gamma_0,
                                                 gamma_1, gamma_2, b, sigma_y,
                                                 log_radon, stl_pred
                                             ])
@tf.function
def sample_contextual_effects_predictive(num_chains, num_results,
                                         num_burnin_steps):
  """Samples from the contextual effects predictive model."""
  hmc = tfp.mcmc.HamiltonianMonteCarlo(
      target_log_prob_fn=contextual_effects_predictive_log_prob,
      num_leapfrog_steps=50,
      step_size=0.01)

  initial_state = [
      tf.ones([num_chains], name='init_sigma_a'),
      tf.zeros([num_chains, num_counties], name='eps_a'),
      tf.zeros([num_chains], name='init_gamma_0'),
      tf.zeros([num_chains], name='init_gamma_1'),
      tf.zeros([num_chains], name='init_gamma_2'),
      tf.zeros([num_chains], name='init_b'),
      tf.ones([num_chains], name='init_sigma_y'),
      tf.zeros([num_chains], name='init_stl_pred')
  ]
  unconstraining_bijectors = [
      tfb.Exp(),       # sigma_a
      tfb.Identity(),  # eps_a
      tfb.Identity(),  # gamma_0
      tfb.Identity(),  # gamma_1
      tfb.Identity(),  # gamma_2
      tfb.Identity(),  # b
      tfb.Chain([tfb.Shift(shift=50.),
                 tfb.Scale(scale=50.),
                 tfb.Tanh()]),  # sigma_y
      tfb.Identity(),  # stl_pred
  ]
  kernel = tfp.mcmc.TransformedTransitionKernel(
      inner_kernel=hmc, bijector=unconstraining_bijectors)
  samples, kernel_results = tfp.mcmc.sample_chain(
      num_results=num_results,
      num_burnin_steps=num_burnin_steps,
      current_state=initial_state,
      kernel=kernel)

  acceptance_probs = tf.reduce_mean(
      tf.cast(kernel_results.inner_results.is_accepted, tf.float32), axis=0)

  return samples, acceptance_probs
ContextualEffectsPredictiveModel = collections.namedtuple(
    'ContextualEffectsPredictiveModel', [
        'sigma_a', 'eps_a', 'gamma_0', 'gamma_1', 'gamma_2', 'b', 'sigma_y',
        'stl_pred'
    ])

samples, acceptance_probs = sample_contextual_effects_predictive(
    num_chains=4, num_results=2000, num_burnin_steps=500)
print('Acceptance Probabilities: ', acceptance_probs.numpy())
contextual_effects_pred_samples = ContextualEffectsPredictiveModel._make(
    samples)
Acceptance Probabilities: [0.9165 0.978 0.9755 0.9785]
for var in [
    'sigma_a', 'gamma_0', 'gamma_1', 'gamma_2', 'b', 'sigma_y', 'stl_pred'
]:
  print(
      'R-hat for ', var, ': ',
      tfp.mcmc.potential_scale_reduction(
          getattr(contextual_effects_pred_samples, var)).numpy())
R-hat for  sigma_a :  1.0325582
R-hat for  gamma_0 :  1.0033548
R-hat for  gamma_1 :  1.0011047
R-hat for  gamma_2 :  1.001153
R-hat for  b :  1.0020066
R-hat for  sigma_y :  1.0128921
R-hat for  stl_pred :  1.0058256
plot_traces('stl_pred', contextual_effects_pred_samples.stl_pred, num_chains=4)

plot_posterior('stl_pred', contextual_effects_pred_samples.stl_pred)
7 บทสรุป
ประโยชน์ของโมเดลหลายระดับ:
- การบัญชีสำหรับโครงสร้างลำดับชั้นตามธรรมชาติของข้อมูลเชิงสังเกต
- การประมาณค่าสัมประสิทธิ์สำหรับกลุ่ม (น้อยกว่า)
- รวมข้อมูลระดับบุคคลและระดับกลุ่มเมื่อประมาณค่าสัมประสิทธิ์ระดับกลุ่ม
- อนุญาตให้มีการเปลี่ยนแปลงระหว่างค่าสัมประสิทธิ์ระดับบุคคลข้ามกลุ่ม
อ้างอิง
Gelman, A. และ Hill, J. (2006). การวิเคราะห์ข้อมูลโดยใช้แบบจำลองการถดถอยและหลายระดับ/ลำดับชั้น (ฉบับที่ 1) สำนักพิมพ์มหาวิทยาลัยเคมบริดจ์.
เกลแมน, เอ. (2549). การสร้างแบบจำลองหลายระดับ (ลำดับชั้น): สิ่งที่ทำได้และไม่สามารถทำได้ เทคโนเมทริก, 48(3), 432–435.
