Этот пример портирован из примера PyMC3 ноутбука учебника по байесовской методе для многоуровневого моделирования
 Посмотреть на TensorFlow.org Посмотреть на TensorFlow.org |  Запускаем в Google Colab Запускаем в Google Colab |  Посмотреть исходный код на GitHub Посмотреть исходный код на GitHub |  Скачать блокнот Скачать блокнот |
Зависимости и предварительные условия
Импортировать
import collections
import os
from six.moves import urllib
import daft as daft
import matplotlib as mpl
import matplotlib.pyplot as plt
import numpy as np
import pandas as pd
import seaborn as sns
import warnings

import tensorflow.compat.v2 as tf
tf.enable_v2_behavior()

import tensorflow_datasets as tfds
import tensorflow_probability as tfp

tfk = tf.keras
tfkl = tf.keras.layers
tfpl = tfp.layers
tfd = tfp.distributions
tfb = tfp.bijectors

warnings.simplefilter('ignore')
1. Введение
В этом colab мы будем соответствовать иерархические линейные модели (HLMs) различной степени сложности модели с использованием популярного Радона набора данных. Мы будем использовать примитивы TFP и его набор инструментов Монте-Карло цепи Маркова.
Чтобы лучше соответствовать данным, наша цель - использовать естественную иерархическую структуру, присутствующую в наборе данных. Мы начинаем с традиционных подходов: полностью объединенные и не объединенные модели. Мы продолжаем изучать многоуровневые модели: исследуем модели частичного объединения, предикторы на уровне группы и контекстные эффекты.
Для соответствующего ноутбука также установки HLMs с использованием TFP на наборе данных Радона, проверить линейный смешанно-эффект регрессии в {Вероятность TF, R, Stan} .
Если у вас есть какие - либо вопросы по поводу материала здесь, не стесняйтесь обращаться к (или присоединиться) список рассылки Вероятность TensorFlow . Мы рады помочь.
2 Обзор многоуровневого моделирования
Учебник по байесовским методам многоуровневого моделирования
Иерархическое или многоуровневое моделирование - это обобщение регрессионного моделирования.
Многоуровневые модели - это регрессионные модели, в которых составляющим параметрам модели даны распределения вероятностей. Это означает, что параметры модели могут варьироваться в зависимости от группы. Единицы наблюдения часто естественно сгруппированы. Кластеризация вызывает зависимость между наблюдениями, несмотря на случайную выборку кластеров и случайную выборку внутри кластеров.
Иерархическая модель - это особая многоуровневая модель, в которой параметры вложены друг в друга. Некоторые многоуровневые структуры не являются иерархическими.
например, «страна» и «год» не вложены друг в друга, но могут представлять отдельные, но перекрывающиеся группы параметров. Мы будем мотивировать эту тему на примере экологической эпидемиологии.
Пример: загрязнение радоном (Гельман и Хилл, 2006)
Радон - это радиоактивный газ, который попадает в дома через точки контакта с землей. Это канцероген, который является основной причиной рака легких у некурящих. Уровни радона сильно различаются от дома к дому.
Агентство по охране окружающей среды провело исследование уровня радона в 80 000 домов. Двумя важными предикторами являются: 1. Измерение в подвале или на первом этаже (радон выше в подвалах) 2. Уровень урана в округе (положительная корреляция с уровнями радона)
Мы сосредоточимся на моделировании уровней радона в Миннесоте. Иерархия в этом примере - это домохозяйства в каждом округе.
3 Переключение данных
В этом разделе мы получим radon набор данных и сделать некоторую минимальную предварительную обработку.
def load_and_preprocess_radon_dataset(state='MN'):
  """Preprocess Radon dataset as done in "Bayesian Data Analysis" book.

  We filter to Minnesota data (919 examples) and preprocess to obtain the
  following features:
  - `log_uranium_ppm`: Log of soil uranium measurements.
  - `county`: Name of county in which the measurement was taken.
  - `floor`: Floor of house (0 for basement, 1 for first floor) on which the
    measurement was taken.

  The target variable is `log_radon`, the log of the Radon measurement in the
  house.
  """
  ds = tfds.load('radon', split='train')
  radon_data = tfds.as_dataframe(ds)
  radon_data.rename(lambda s: s[9:] if s.startswith('feat') else s, axis=1, inplace=True)
  df = radon_data[radon_data.state==state.encode()].copy()

  # For any missing or invalid activity readings, we'll use a value of `0.1`.
  df['radon'] = df.activity.apply(lambda x: x if x > 0. else 0.1)
  # Make county names look nice.
  df['county'] = df.county.apply(lambda s: s.decode()).str.strip().str.title()
  # Remap categories to start from 0 and end at max(category).
  county_name = sorted(df.county.unique())
  df['county'] = df.county.astype(
      pd.api.types.CategoricalDtype(categories=county_name)).cat.codes
  county_name = list(map(str.strip, county_name))

  df['log_radon'] = df['radon'].apply(np.log)
  df['log_uranium_ppm'] = df['Uppm'].apply(np.log)
  df = df[['idnum', 'log_radon', 'floor', 'county', 'log_uranium_ppm']]

  return df, county_name
radon, county_name = load_and_preprocess_radon_dataset()
num_counties = len(county_name)
num_observations = len(radon)
# Create copies of variables as Tensors.
county = tf.convert_to_tensor(radon['county'], dtype=tf.int32)
floor = tf.convert_to_tensor(radon['floor'], dtype=tf.float32)
log_radon = tf.convert_to_tensor(radon['log_radon'], dtype=tf.float32)
log_uranium = tf.convert_to_tensor(radon['log_uranium_ppm'], dtype=tf.float32)
radon.head()
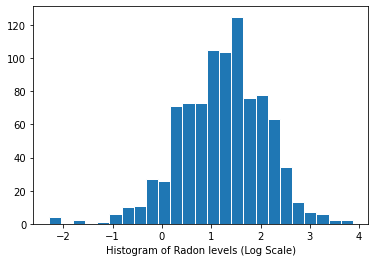
Распределение уровней радона (логарифмическая шкала):
plt.hist(log_radon.numpy(), bins=25, edgecolor='white')
plt.xlabel("Histogram of Radon levels (Log Scale)")
plt.show()
4 Стандартные подходы
Две традиционные альтернативы моделированию облучения радоном представляют собой две крайности компромисса смещения и дисперсии:
Полный пул:
Относитесь ко всем округам одинаково и оцените единый уровень радона.
\[y_i = \alpha + \beta x_i + \epsilon_i\]
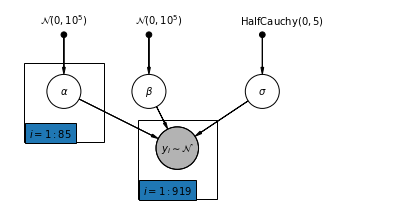
Без объединения:
Смоделируйте радон в каждом уезде независимо.
\(y_i = \alpha_{j[i]} + \beta x_i + \epsilon_i\) где \(j = 1,\ldots,85\)
Ошибки \(\epsilon_i\) может представлять ошибку измерения, временную внутри дома-вариации, или вариации среди домов.
4.1 Полная модель пула
pgm = daft.PGM([7, 3.5], node_unit=1.2)
pgm.add_node(
    daft.Node(
        "alpha_prior",
        r"$\mathcal{N}(0, 10^5)$",
        1,
        3,
        fixed=True,
        offset=(0, 5)))
pgm.add_node(
    daft.Node(
        "beta_prior",
        r"$\mathcal{N}(0, 10^5)$",
        2.5,
        3,
        fixed=True,
        offset=(10, 5)))
pgm.add_node(
    daft.Node(
        "sigma_prior",
        r"$\mathrm{HalfCauchy}(0, 5)$",
        4.5,
        3,
        fixed=True,
        offset=(20, 5)))
pgm.add_node(daft.Node("alpha", r"$\alpha$", 1, 2))
pgm.add_node(daft.Node("beta", r"$\beta$", 2.5, 2))
pgm.add_node(daft.Node("sigma", r"$\sigma$", 4.5, 2))
pgm.add_node(
    daft.Node(
        "y_i", r"$y_i \sim \mathcal{N}$", 3, 1, scale=1.25, observed=True))
pgm.add_edge("alpha_prior", "alpha")
pgm.add_edge("beta_prior", "beta")
pgm.add_edge("sigma_prior", "sigma")
pgm.add_edge("sigma", "y_i")
pgm.add_edge("alpha", "y_i")
pgm.add_edge("beta", "y_i")
pgm.add_plate(daft.Plate([2.3, 0.1, 1.4, 1.4], "$i = 1:919$"))

pgm.render()
plt.show()
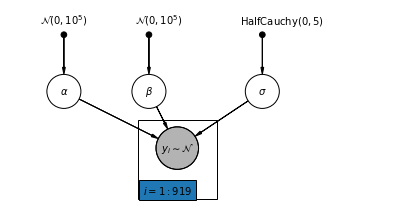
Ниже мы подбираем полную модель пула с использованием гамильтониана Монте-Карло.
@tf.function
def affine(x, kernel_diag, bias=tf.zeros([])):
  """`kernel_diag * x + bias` with broadcasting."""
  kernel_diag = tf.ones_like(x) * kernel_diag
  bias = tf.ones_like(x) * bias
  return x * kernel_diag + bias
def pooled_model(floor):
  """Creates a joint distribution representing our generative process."""
  return tfd.JointDistributionSequential([
      tfd.Normal(loc=0., scale=1e5),  # alpha
      tfd.Normal(loc=0., scale=1e5),  # beta
      tfd.HalfCauchy(loc=0., scale=5),  # sigma
      lambda s, b1, b0: tfd.MultivariateNormalDiag(  # y
          loc=affine(floor, b1[..., tf.newaxis], b0[..., tf.newaxis]),
          scale_identity_multiplier=s)
  ])


@tf.function
def pooled_log_prob(alpha, beta, sigma):
  """Computes `joint_log_prob` pinned at `log_radon`."""
  return pooled_model(floor).log_prob([alpha, beta, sigma, log_radon])
@tf.function
def sample_pooled(num_chains, num_results, num_burnin_steps, num_observations):
  """Samples from the pooled model."""
  hmc = tfp.mcmc.HamiltonianMonteCarlo(
      target_log_prob_fn=pooled_log_prob,
      num_leapfrog_steps=10,
      step_size=0.005)

  initial_state = [
      tf.zeros([num_chains], name='init_alpha'),
      tf.zeros([num_chains], name='init_beta'),
      tf.ones([num_chains], name='init_sigma')
  ]

  # Constrain `sigma` to the positive real axis. Other variables are
  # unconstrained.
  unconstraining_bijectors = [
      tfb.Identity(),  # alpha
      tfb.Identity(),  # beta
      tfb.Exp()        # sigma
  ]
  kernel = tfp.mcmc.TransformedTransitionKernel(
      inner_kernel=hmc, bijector=unconstraining_bijectors)

  samples, kernel_results = tfp.mcmc.sample_chain(
      num_results=num_results,
      num_burnin_steps=num_burnin_steps,
      current_state=initial_state,
      kernel=kernel)

  acceptance_probs = tf.reduce_mean(
      tf.cast(kernel_results.inner_results.is_accepted, tf.float32), axis=0)

  return samples, acceptance_probs
PooledModel = collections.namedtuple('PooledModel', ['alpha', 'beta', 'sigma'])

samples, acceptance_probs = sample_pooled(
    num_chains=4,
    num_results=1000,
    num_burnin_steps=1000,
    num_observations=num_observations)

print('Acceptance Probabilities for each chain: ', acceptance_probs.numpy())
pooled_samples = PooledModel._make(samples)
Acceptance Probabilities for each chain: [0.997 0.99 0.997 0.995]
for var, var_samples in pooled_samples._asdict().items():
  print('R-hat for ', var, ':\t',
        tfp.mcmc.potential_scale_reduction(var_samples).numpy())
R-hat for  alpha :     1.0046891
R-hat for  beta :  1.0128309
R-hat for  sigma :     1.0010641
def reduce_samples(var_samples, reduce_fn):
  """Reduces across leading two dims using reduce_fn."""
  # Collapse the first two dimensions, typically (num_chains, num_samples), and
  # compute np.mean or np.std along the remaining axis.
  if isinstance(var_samples, tf.Tensor):
    var_samples = var_samples.numpy() # convert to numpy array
  var_samples = np.reshape(var_samples, (-1,) +  var_samples.shape[2:])
  return np.apply_along_axis(reduce_fn, axis=0, arr=var_samples)

sample_mean = lambda samples : reduce_samples(samples, np.mean)
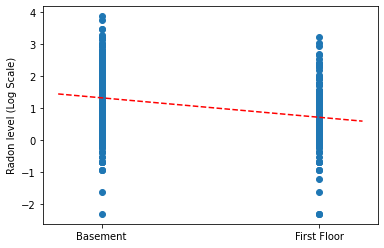
Постройте точечные оценки наклона и точки пересечения для полной модели объединения.
LinearEstimates = collections.namedtuple('LinearEstimates',
                                        ['intercept', 'slope'])

pooled_estimate = LinearEstimates(
  intercept=sample_mean(pooled_samples.alpha),
  slope=sample_mean(pooled_samples.beta)
)

plt.scatter(radon.floor, radon.log_radon)
xvals = np.linspace(-0.2, 1.2)
plt.ylabel('Radon level (Log Scale)')
plt.xticks([0, 1], ['Basement', 'First Floor'])
plt.plot(xvals, pooled_estimate.intercept + pooled_estimate.slope * xvals, 'r--')
plt.show()
Функция полезности для построения следов выбранных переменных.
def plot_traces(var_name, samples, num_chains):
  if isinstance(samples, tf.Tensor):
    samples = samples.numpy() # convert to numpy array
  fig, axes = plt.subplots(1, 2, figsize=(14, 1.5), sharex='col', sharey='col')
  for chain in range(num_chains):
    axes[0].plot(samples[:, chain], alpha=0.7)
    axes[0].title.set_text("'{}' trace".format(var_name))
    sns.kdeplot(samples[:, chain], ax=axes[1], shade=False)
    axes[1].title.set_text("'{}' distribution".format(var_name))
    axes[0].set_xlabel('Iteration')
    axes[1].set_xlabel(var_name)
  plt.show()
for var, var_samples in pooled_samples._asdict().items():
  plot_traces(var, samples=var_samples, num_chains=4)


Затем мы оцениваем уровни радона для каждого округа в не объединенной модели.
4.2 Модель без пула
pgm = daft.PGM([7, 3.5], node_unit=1.2)
pgm.add_node(
    daft.Node(
        "alpha_prior",
        r"$\mathcal{N}(0, 10^5)$",
        1,
        3,
        fixed=True,
        offset=(0, 5)))
pgm.add_node(
    daft.Node(
        "beta_prior",
        r"$\mathcal{N}(0, 10^5)$",
        2.5,
        3,
        fixed=True,
        offset=(10, 5)))
pgm.add_node(
    daft.Node(
        "sigma_prior",
        r"$\mathrm{HalfCauchy}(0, 5)$",
        4.5,
        3,
        fixed=True,
        offset=(20, 5)))
pgm.add_node(daft.Node("alpha", r"$\alpha$", 1, 2))
pgm.add_node(daft.Node("beta", r"$\beta$", 2.5, 2))
pgm.add_node(daft.Node("sigma", r"$\sigma$", 4.5, 2))
pgm.add_node(
    daft.Node(
        "y_i", r"$y_i \sim \mathcal{N}$", 3, 1, scale=1.25, observed=True))
pgm.add_edge("alpha_prior", "alpha")
pgm.add_edge("beta_prior", "beta")
pgm.add_edge("sigma_prior", "sigma")
pgm.add_edge("sigma", "y_i")
pgm.add_edge("alpha", "y_i")
pgm.add_edge("beta", "y_i")
pgm.add_plate(daft.Plate([0.3, 1.1, 1.4, 1.4], "$i = 1:85$"))
pgm.add_plate(daft.Plate([2.3, 0.1, 1.4, 1.4], "$i = 1:919$"))

pgm.render()
plt.show()
def unpooled_model(floor, county):
  """Creates a joint distribution for the unpooled model."""
  return tfd.JointDistributionSequential([
      tfd.MultivariateNormalDiag(       # alpha
          loc=tf.zeros([num_counties]), scale_identity_multiplier=1e5),
      tfd.Normal(loc=0., scale=1e5),    # beta
      tfd.HalfCauchy(loc=0., scale=5),  # sigma
      lambda s, b1, b0: tfd.MultivariateNormalDiag(  # y
          loc=affine(
            floor, b1[..., tf.newaxis], tf.gather(b0, county, axis=-1)),
          scale_identity_multiplier=s)
  ])


@tf.function
def unpooled_log_prob(beta0, beta1, sigma):
  """Computes `joint_log_prob` pinned at `log_radon`."""
  return (
    unpooled_model(floor, county).log_prob([beta0, beta1, sigma, log_radon]))
@tf.function
def sample_unpooled(num_chains, num_results, num_burnin_steps):
  """Samples from the unpooled model."""
  # Initialize the HMC transition kernel.
  hmc = tfp.mcmc.HamiltonianMonteCarlo(
      target_log_prob_fn=unpooled_log_prob,
      num_leapfrog_steps=10,
      step_size=0.025)

  initial_state = [
      tf.zeros([num_chains, num_counties], name='init_beta0'),
      tf.zeros([num_chains], name='init_beta1'),
      tf.ones([num_chains], name='init_sigma')
  ]
  # Contrain `sigma` to the positive real axis. Other variables are
  # unconstrained.
  unconstraining_bijectors = [
      tfb.Identity(),  # alpha
      tfb.Identity(),  # beta
      tfb.Exp()        # sigma
  ]
  kernel = tfp.mcmc.TransformedTransitionKernel(
      inner_kernel=hmc, bijector=unconstraining_bijectors)
  samples, kernel_results = tfp.mcmc.sample_chain(
      num_results=num_results,
      num_burnin_steps=num_burnin_steps,
      current_state=initial_state,
      kernel=kernel)

  acceptance_probs = tf.reduce_mean(
      tf.cast(kernel_results.inner_results.is_accepted, tf.float32), axis=0)

  return samples, acceptance_probs
UnpooledModel = collections.namedtuple('UnpooledModel',
                                       ['alpha', 'beta', 'sigma'])

samples, acceptance_probs = sample_unpooled(
    num_chains=4, num_results=1000, num_burnin_steps=1000)

print('Acceptance Probabilities: ', acceptance_probs.numpy())
unpooled_samples = UnpooledModel._make(samples)

print('R-hat for beta:',
      tfp.mcmc.potential_scale_reduction(unpooled_samples.beta).numpy())
print('R-hat for sigma:',
      tfp.mcmc.potential_scale_reduction(unpooled_samples.sigma).numpy())
Acceptance Probabilities:  [0.892 0.897 0.911 0.91 ]
R-hat for beta: 1.0079623
R-hat for sigma: 1.0059084
plot_traces(var_name='beta', samples=unpooled_samples.beta, num_chains=4)
plot_traces(var_name='sigma', samples=unpooled_samples.sigma, num_chains=4)


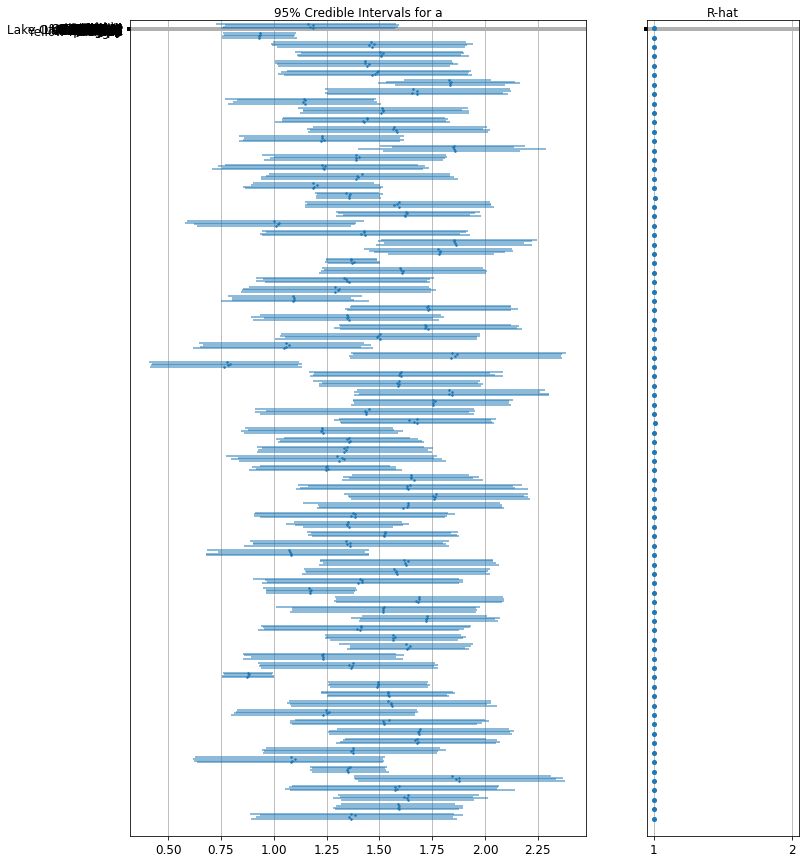
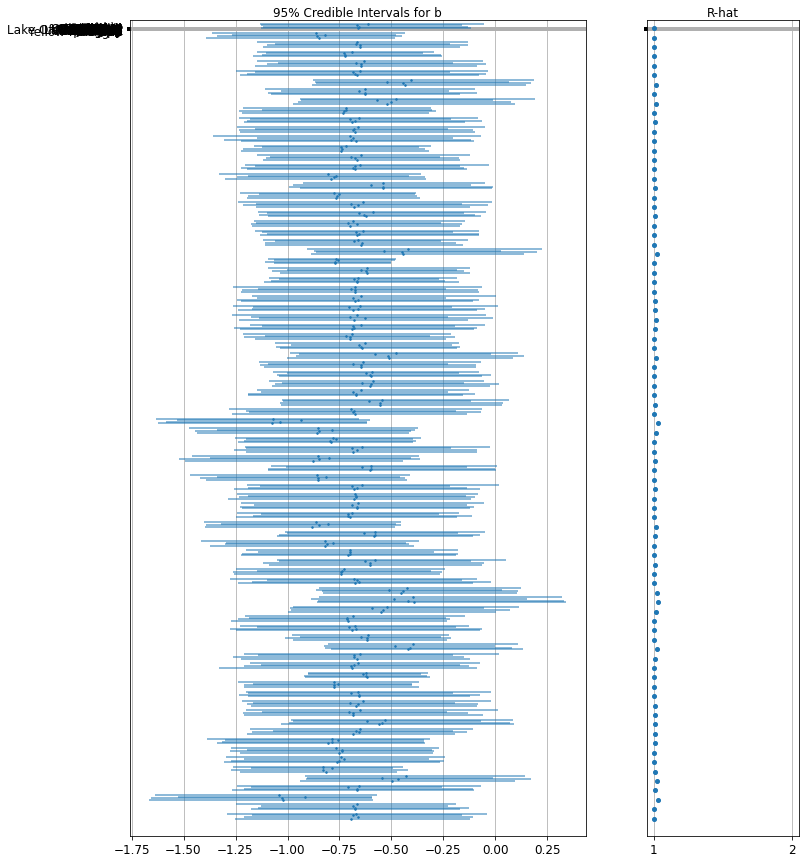
Вот не объединенные ожидаемые значения округа для точки пересечения, а также 95% вероятных интервалов для каждой цепочки. Мы также указываем значение R-шляпы для оценки каждого округа.
Функция полезности для лесных участков.
def forest_plot(num_chains, num_vars, var_name, var_labels, samples):
  fig, axes = plt.subplots(
      1, 2, figsize=(12, 15), sharey=True, gridspec_kw={'width_ratios': [3, 1]})
  for var_idx in range(num_vars):
    values = samples[..., var_idx]
    rhat = tfp.mcmc.diagnostic.potential_scale_reduction(values).numpy()
    meds = np.median(values, axis=-2)
    los = np.percentile(values, 5, axis=-2)
    his = np.percentile(values, 95, axis=-2)

    for i in range(num_chains):
      height = 0.1 + 0.3 * var_idx + 0.05 * i
      axes[0].plot([los[i], his[i]], [height, height], 'C0-', lw=2, alpha=0.5)
      axes[0].plot([meds[i]], [height], 'C0o', ms=1.5)
    axes[1].plot([rhat], [height], 'C0o', ms=4)

  axes[0].set_yticks(np.linspace(0.2, 0.3, num_vars))
  axes[0].set_ylim(0, 26)
  axes[0].grid(which='both')
  axes[0].invert_yaxis()
  axes[0].set_yticklabels(var_labels)
  axes[0].xaxis.set_label_position('top')
  axes[0].set(xlabel='95% Credible Intervals for {}'.format(var_name))

  axes[1].set_xticks([1, 2])
  axes[1].set_xlim(0.95, 2.05)
  axes[1].grid(which='both')
  axes[1].set(xlabel='R-hat')
  axes[1].xaxis.set_label_position('top')

  plt.show()
forest_plot(
    num_chains=4,
    num_vars=num_counties,
    var_name='alpha',
    var_labels=county_name,
    samples=unpooled_samples.alpha.numpy())
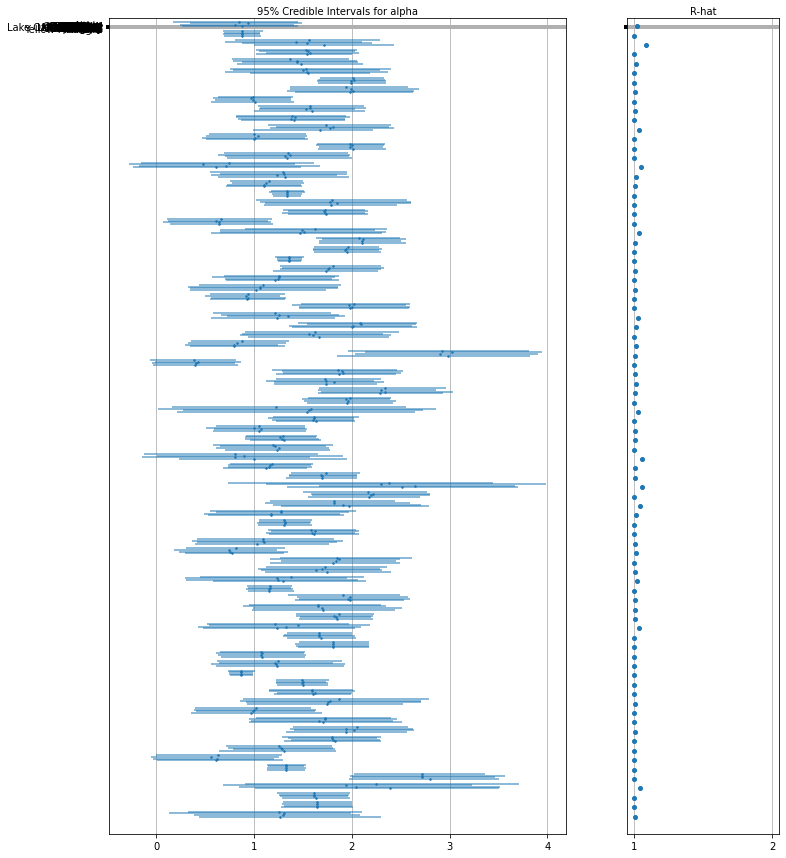
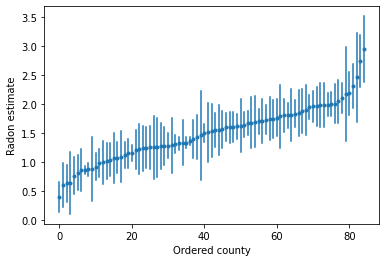
Мы можем построить упорядоченные оценки для выявления округов с высоким уровнем радона:
unpooled_intercepts = reduce_samples(unpooled_samples.alpha, np.mean)
unpooled_intercepts_se = reduce_samples(unpooled_samples.alpha, np.std)

def plot_ordered_estimates():
  means = pd.Series(unpooled_intercepts, index=county_name)
  std_errors = pd.Series(unpooled_intercepts_se, index=county_name)
  order = means.sort_values().index

  plt.plot(range(num_counties), means[order], '.')
  for i, m, se in zip(range(num_counties), means[order], std_errors[order]):
    plt.plot([i, i], [m - se, m + se], 'C0-')
  plt.xlabel('Ordered county')
  plt.ylabel('Radon estimate')
  plt.show()

plot_ordered_estimates()
Функция полезности для построения оценок для выборки округов.
def plot_estimates(linear_estimates, labels, sample_counties):
  fig, axes = plt.subplots(2, 4, figsize=(12, 6), sharey=True, sharex=True)
  axes = axes.ravel()
  intercepts_indexed = []
  slopes_indexed = []
  for intercepts, slopes in linear_estimates:
    intercepts_indexed.append(pd.Series(intercepts, index=county_name))
    slopes_indexed.append(pd.Series(slopes, index=county_name))

  markers = ['-', 'r--', 'k:']
  sample_county_codes = [county_name.index(c) for c in sample_counties]
  for i, c in enumerate(sample_county_codes):
    y = radon.log_radon[radon.county == c]
    x = radon.floor[radon.county == c]
    axes[i].scatter(
        x + np.random.randn(len(x)) * 0.01, y, alpha=0.4, label='Log Radon')

    # Plot both models and data
    xvals = np.linspace(-0.2, 1.2)
    for k in range(len(intercepts_indexed)):
      axes[i].plot(
          xvals,
          intercepts_indexed[k][c] + slopes_indexed[k][c] * xvals,
          markers[k],
          label=labels[k])

    axes[i].set_xticks([0, 1])
    axes[i].set_xticklabels(['Basement', 'First Floor'])
    axes[i].set_ylim(-1, 3)
    axes[i].set_title(sample_counties[i])
    if not i % 2:
      axes[i].set_ylabel('Log Radon level')
  axes[3].legend(bbox_to_anchor=(1.05, 0.9), borderaxespad=0.)

  plt.show()
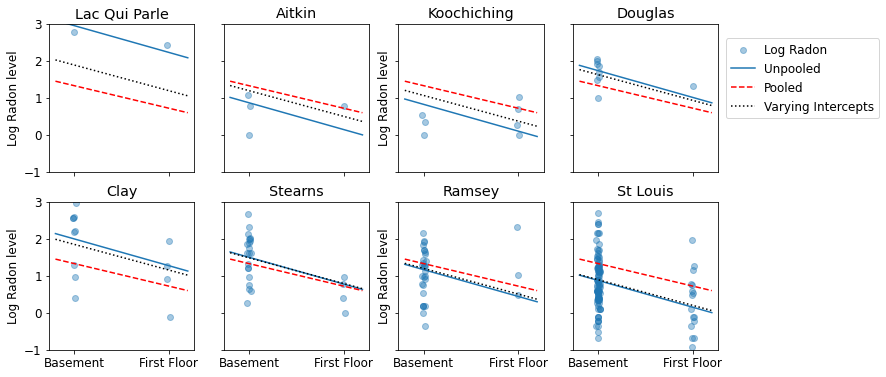
Ниже представлены визуальные сравнения объединенных и не объединенных оценок для подмножества округов, представляющих диапазон размеров выборки.
unpooled_estimates = LinearEstimates(
  sample_mean(unpooled_samples.alpha),
  sample_mean(unpooled_samples.beta)
)

sample_counties = ('Lac Qui Parle', 'Aitkin', 'Koochiching', 'Douglas', 'Clay',
                   'Stearns', 'Ramsey', 'St Louis')
plot_estimates(
    linear_estimates=[unpooled_estimates, pooled_estimate],
    labels=['Unpooled Estimates', 'Pooled Estimates'],
    sample_counties=sample_counties)
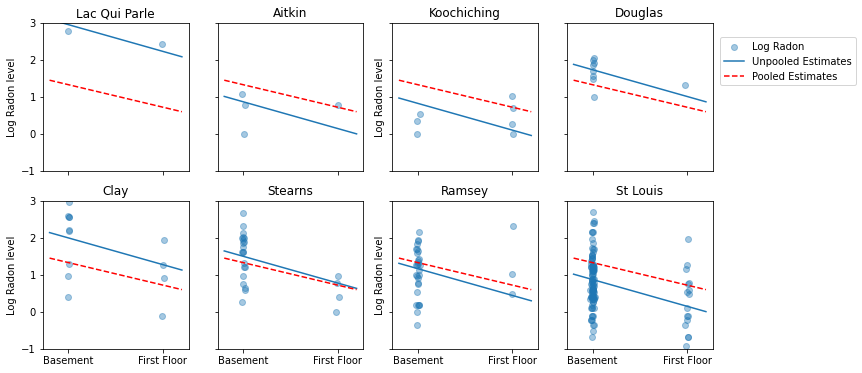
Ни одна из этих моделей не является удовлетворительной:
- если мы пытаемся идентифицировать округа с высоким содержанием радона, объединение бесполезно.
- мы не доверяем крайним не объединенным оценкам, полученным с помощью моделей, использующих небольшое количество наблюдений.
5 Многоуровневые и иерархические модели
Когда мы объединяем наши данные, мы теряем информацию о том, что разные точки данных поступили из разных стран. Это означает , что каждый radon -LEVEL наблюдение выборочные из того же распределения вероятностей. Такая модель не может изучить какие-либо вариации в единице выборки, присущие группе (например, округу). Он учитывает только дисперсию выборки.
mpl.rc("font", size=18)

pgm = daft.PGM([13.6, 2.2], origin=[1.15, 1.0], node_ec="none")
pgm.add_node(daft.Node("parameter", r"parameter", 2.0, 3))
pgm.add_node(daft.Node("observations", r"observations", 2.0, 2))
pgm.add_node(daft.Node("theta", r"$\theta$", 5.5, 3))
pgm.add_node(daft.Node("y_0", r"$y_0$", 4, 2))
pgm.add_node(daft.Node("y_1", r"$y_1$", 5, 2))
pgm.add_node(daft.Node("dots", r"$\cdots$", 6, 2))
pgm.add_node(daft.Node("y_k", r"$y_k$", 7, 2))
pgm.add_edge("theta", "y_0")
pgm.add_edge("theta", "y_1")
pgm.add_edge("theta", "y_k")
pgm.render()
plt.show()

Когда мы анализируем данные без пула, мы подразумеваем, что они отбираются независимо от отдельных моделей. В противоположность объединенному случаю, этот подход утверждает, что различия между единицами выборки слишком велики, чтобы их объединить:
mpl.rc("font", size=18)

pgm = daft.PGM([13.6, 2.2], origin=[1.15, 1.0], node_ec="none")
pgm.add_node(daft.Node("parameter", r"parameter", 2.0, 3))
pgm.add_node(daft.Node("observations", r"observations", 2.0, 2))
pgm.add_node(daft.Node("theta_0", r"$\theta_0$", 4, 3))
pgm.add_node(daft.Node("theta_1", r"$\theta_1$", 5, 3))
pgm.add_node(daft.Node("theta_dots", r"$\cdots$", 6, 3))
pgm.add_node(daft.Node("theta_k", r"$\theta_k$", 7, 3))

pgm.add_node(daft.Node("y_0", r"$y_0$", 4, 2))
pgm.add_node(daft.Node("y_1", r"$y_1$", 5, 2))
pgm.add_node(daft.Node("y_dots", r"$\cdots$", 6, 2))
pgm.add_node(daft.Node("y_k", r"$y_k$", 7, 2))
pgm.add_edge("theta_0", "y_0")
pgm.add_edge("theta_1", "y_1")
pgm.add_edge("theta_k", "y_k")
pgm.render()
plt.show()

В иерархической модели параметры рассматриваются как выборка из совокупного распределения параметров. Таким образом, мы не рассматриваем их как совершенно разные или абсолютно одинаковые. Это известно как частичное объединение.
mpl.rc("font", size=18)

pgm = daft.PGM([13.6, 3.4], origin=[1.15, 1.0], node_ec="none")
pgm.add_node(daft.Node("model", r"model", 2.0, 4))
pgm.add_node(daft.Node("parameter", r"parameter", 2.0, 3))
pgm.add_node(daft.Node("observations", r"observations", 2.0, 2))
pgm.add_node(daft.Node("mu_sigma", r"$\mu,\sigma^2$", 5.5, 4))
pgm.add_node(daft.Node("theta_0", r"$\theta_0$", 4, 3))
pgm.add_node(daft.Node("theta_1", r"$\theta_1$", 5, 3))
pgm.add_node(daft.Node("theta_dots", r"$\cdots$", 6, 3))
pgm.add_node(daft.Node("theta_k", r"$\theta_k$", 7, 3))
pgm.add_node(daft.Node("y_0", r"$y_0$", 4, 2))
pgm.add_node(daft.Node("y_1", r"$y_1$", 5, 2))
pgm.add_node(daft.Node("y_dots", r"$\cdots$", 6, 2))
pgm.add_node(daft.Node("y_k", r"$y_k$", 7, 2))
pgm.add_edge("mu_sigma", "theta_0")
pgm.add_edge("mu_sigma", "theta_1")
pgm.add_edge("mu_sigma", "theta_k")
pgm.add_edge("theta_0", "y_0")
pgm.add_edge("theta_1", "y_1")
pgm.add_edge("theta_k", "y_k")
pgm.render()
plt.show()

5.1 Частичное объединение
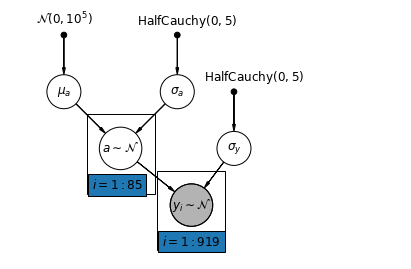
Самая простая модель частичного объединения для набора данных по радону в домашних условиях - это модель, которая просто оценивает уровни радона без каких-либо предикторов на групповом или индивидуальном уровне. Примером предиктора индивидуального уровня является то, находится ли точка данных в подвале или на первом этаже. Предиктором на уровне группы могут быть средние уровни урана в округе.
Модель частичного объединения представляет собой компромисс между объединенными и не объединенными крайними значениями, приблизительно средневзвешенным (на основе размера выборки) не объединенными оценками округа и объединенными оценками.
Пусть \(\hat{\alpha}_j\) быть оцененный уровень входа радона в графстве \(j\). Это просто перехват; мы пока игнорируем склоны. \(n_j\) это число наблюдений из графства \(j\). \(\sigma_{\alpha}\) и \(\sigma_y\) являются дисперсия в пределах параметра и выборки дисперсии соответственно. Тогда модель частичного пула могла бы постулировать:
\[\hat{\alpha}_j \approx \frac{(n_j/\sigma_y^2)\bar{y}_j + (1/\sigma_{\alpha}^2)\bar{y} }{(n_j/\sigma_y^2) + (1/\sigma_{\alpha}^2)}\]
При использовании частичного пула мы ожидаем следующего:
- Оценки для округов с меньшими размерами выборки будут сокращаться до среднего значения по штату.
- Оценки для округов с более крупными размерами выборки будут ближе к не объединенным оценкам округов.
mpl.rc("font", size=12)
pgm = daft.PGM([7, 4.5], node_unit=1.2)
pgm.add_node(
    daft.Node(
        "mu_a_prior",
        r"$\mathcal{N}(0, 10^5)$",
        1,
        4,
        fixed=True,
        offset=(0, 5)))
pgm.add_node(
    daft.Node(
        "sigma_a_prior",
        r"$\mathrm{HalfCauchy}(0, 5)$",
        3,
        4,
        fixed=True,
        offset=(10, 5)))
pgm.add_node(
    daft.Node(
        "sigma_prior",
        r"$\mathrm{HalfCauchy}(0, 5)$",
        4,
        3,
        fixed=True,
        offset=(20, 5)))
pgm.add_node(daft.Node("mu_a", r"$\mu_a$", 1, 3))
pgm.add_node(daft.Node("sigma_a", r"$\sigma_a$", 3, 3))
pgm.add_node(daft.Node("a", r"$a \sim \mathcal{N}$", 2, 2, scale=1.25))
pgm.add_node(daft.Node("sigma_y", r"$\sigma_y$", 4, 2))
pgm.add_node(
    daft.Node(
        "y_i", r"$y_i \sim \mathcal{N}$", 3.25, 1, scale=1.25, observed=True))
pgm.add_edge("mu_a_prior", "mu_a")
pgm.add_edge("sigma_a_prior", "sigma_a")
pgm.add_edge("mu_a", "a")
pgm.add_edge("sigma_a", "a")
pgm.add_edge("sigma_prior", "sigma_y")
pgm.add_edge("sigma_y", "y_i")
pgm.add_edge("a", "y_i")
pgm.add_plate(daft.Plate([1.4, 1.2, 1.2, 1.4], "$i = 1:85$"))
pgm.add_plate(daft.Plate([2.65, 0.2, 1.2, 1.4], "$i = 1:919$"))

pgm.render()
plt.show()
def partial_pooling_model(county):
  """Creates a joint distribution for the partial pooling model."""
  return tfd.JointDistributionSequential([
      tfd.Normal(loc=0., scale=1e5),    # mu_a
      tfd.HalfCauchy(loc=0., scale=5),  # sigma_a
      lambda sigma_a, mu_a: tfd.MultivariateNormalDiag(  # a
          loc=mu_a[..., tf.newaxis] * tf.ones([num_counties])[tf.newaxis, ...],
          scale_identity_multiplier=sigma_a),
      tfd.HalfCauchy(loc=0., scale=5),  # sigma_y
      lambda sigma_y, a: tfd.MultivariateNormalDiag(  # y
          loc=tf.gather(a, county, axis=-1),
          scale_identity_multiplier=sigma_y)
  ])


@tf.function
def partial_pooling_log_prob(mu_a, sigma_a, a, sigma_y):
  """Computes joint log prob pinned at `log_radon`."""
  return partial_pooling_model(county).log_prob(
      [mu_a, sigma_a, a, sigma_y, log_radon])
@tf.function
def sample_partial_pooling(num_chains, num_results, num_burnin_steps):
  """Samples from the partial pooling model."""
  hmc = tfp.mcmc.HamiltonianMonteCarlo(
      target_log_prob_fn=partial_pooling_log_prob,
      num_leapfrog_steps=10,
      step_size=0.01)

  initial_state = [
      tf.zeros([num_chains], name='init_mu_a'),
      tf.ones([num_chains], name='init_sigma_a'),
      tf.zeros([num_chains, num_counties], name='init_a'),
      tf.ones([num_chains], name='init_sigma_y')
  ]
  unconstraining_bijectors = [
      tfb.Identity(),  # mu_a
      tfb.Exp(),       # sigma_a
      tfb.Identity(),  # a
      tfb.Exp()        # sigma_y
  ]
  kernel = tfp.mcmc.TransformedTransitionKernel(
      inner_kernel=hmc, bijector=unconstraining_bijectors)
  samples, kernel_results = tfp.mcmc.sample_chain(
      num_results=num_results,
      num_burnin_steps=num_burnin_steps,
      current_state=initial_state,
      kernel=kernel)

  acceptance_probs = tf.reduce_mean(
      tf.cast(kernel_results.inner_results.is_accepted, tf.float32), axis=0)

  return samples, acceptance_probs
PartialPoolingModel = collections.namedtuple(
    'PartialPoolingModel', ['mu_a', 'sigma_a', 'a', 'sigma_y'])

samples, acceptance_probs = sample_partial_pooling(
    num_chains=4, num_results=1000, num_burnin_steps=1000)

print('Acceptance Probabilities: ', acceptance_probs.numpy())
partial_pooling_samples = PartialPoolingModel._make(samples)
Acceptance Probabilities: [0.989 0.977 0.988 0.985]
for var in ['mu_a', 'sigma_a', 'sigma_y']:
  print(
      'R-hat for ', var, '\t:',
      tfp.mcmc.potential_scale_reduction(getattr(partial_pooling_samples,
                                                 var)).numpy())
R-hat for  mu_a     : 1.0216417
R-hat for  sigma_a  : 1.0224565
R-hat for  sigma_y  : 1.0016255
partial_pooling_intercepts = reduce_samples(
    partial_pooling_samples.a.numpy(), np.mean)
partial_pooling_intercepts_se = reduce_samples(
    partial_pooling_samples.a.numpy(), np.std)

def plot_unpooled_vs_partial_pooling_estimates():
  fig, axes = plt.subplots(1, 2, figsize=(14, 6), sharex=True, sharey=True)

  # Order counties by number of observations (and add some jitter).
  num_obs_per_county = (
      radon.groupby('county')['idnum'].count().values.astype(np.float32))
  num_obs_per_county += np.random.normal(scale=0.5, size=num_counties)

  intercepts_list = [unpooled_intercepts, partial_pooling_intercepts]
  intercepts_se_list = [unpooled_intercepts_se, partial_pooling_intercepts_se]

  for ax, means, std_errors in zip(axes, intercepts_list, intercepts_se_list):
    ax.plot(num_obs_per_county, means, 'C0.')
    for n, m, se in zip(num_obs_per_county, means, std_errors):
      ax.plot([n, n], [m - se, m + se], 'C1-', alpha=.5)

  for ax in axes:
    ax.set_xscale('log')
    ax.set_xlabel('No. of Observations Per County')
    ax.set_xlim(1, 100)
    ax.set_ylabel('Log Radon Estimate (with Standard Error)')
    ax.set_ylim(0, 3)
    ax.hlines(partial_pooling_intercepts.mean(), .9, 125, 'k', '--', alpha=.5)
  axes[0].set_title('Unpooled Estimates')
  axes[1].set_title('Partially Pooled Estimates')

plot_unpooled_vs_partial_pooling_estimates()
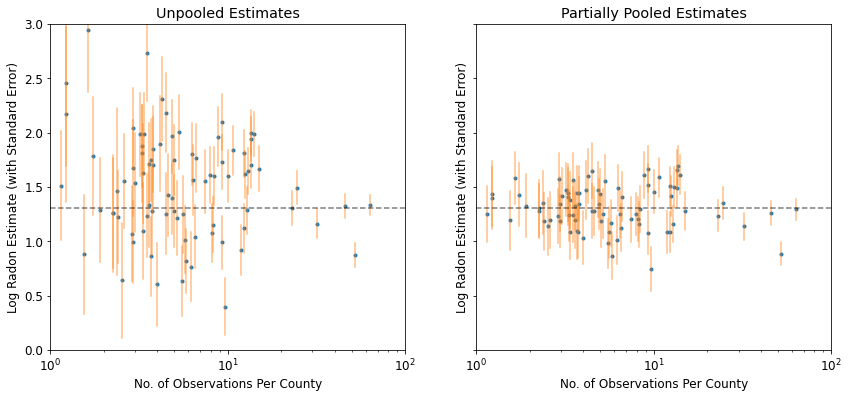
Обратите внимание на разницу между не объединенными и частично объединенными оценками, особенно при меньших размерах выборки. Первые являются более радикальными и неточными.
5.2 Различные точки перехвата
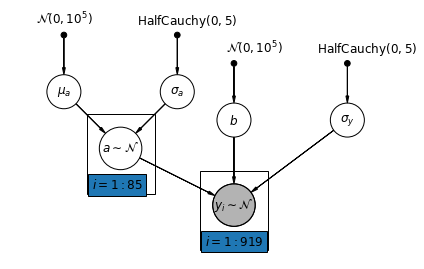
Теперь мы рассмотрим более сложную модель, которая позволяет перехватам варьироваться в зависимости от округа в соответствии со случайным эффектом.
\(y_i = \alpha_{j[i]} + \beta x_{i} + \epsilon_i\) , где\(\epsilon_i \sim N(0, \sigma_y^2)\) и отсекаемый отрезок случайного эффект:
\[\alpha_{j[i]} \sim N(\mu_{\alpha}, \sigma_{\alpha}^2)\]
Склон \(\beta\), который позволяет наблюдение варьироваться в зависимости от места измерения (подвала или первого этажа), по - прежнему фиксированный эффект распределяется между различными странами.
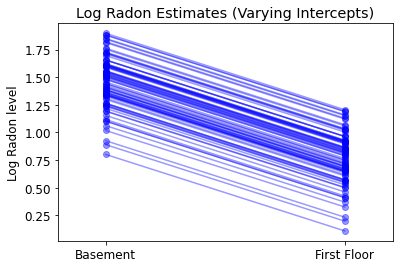
Как и в unpooling модели, мы установили отдельный перехватывать для каждого округа, но вместо установки отдельных наименьших квадратов модели регрессии для каждого округа, многоуровневого силы моделирования акций среди стран, что позволяет более разумные умозаключения в уездах с небольшими данными.
mpl.rc("font", size=12)
pgm = daft.PGM([7, 4.5], node_unit=1.2)
pgm.add_node(
    daft.Node(
        "mu_a_prior",
        r"$\mathcal{N}(0, 10^5)$",
        1,
        4,
        fixed=True,
        offset=(0, 5)))
pgm.add_node(
    daft.Node(
        "sigma_a_prior",
        r"$\mathrm{HalfCauchy}(0, 5)$",
        3,
        4,
        fixed=True,
        offset=(10, 5)))
pgm.add_node(
    daft.Node(
        "b_prior",
        r"$\mathcal{N}(0, 10^5)$",
        4,
        3.5,
        fixed=True,
        offset=(20, 5)))
pgm.add_node(daft.Node("b", r"$b$", 4, 2.5))
pgm.add_node(
    daft.Node(
        "sigma_prior",
        r"$\mathrm{HalfCauchy}(0, 5)$",
        6,
        3.5,
        fixed=True,
        offset=(20, 5)))
pgm.add_node(daft.Node("mu_a", r"$\mu_a$", 1, 3))
pgm.add_node(daft.Node("sigma_a", r"$\sigma_a$", 3, 3))
pgm.add_node(daft.Node("a", r"$a \sim \mathcal{N}$", 2, 2, scale=1.25))
pgm.add_node(daft.Node("sigma_y", r"$\sigma_y$", 6, 2.5))
pgm.add_node(
    daft.Node(
        "y_i", r"$y_i \sim \mathcal{N}$", 4, 1, scale=1.25, observed=True))
pgm.add_edge("mu_a_prior", "mu_a")
pgm.add_edge("sigma_a_prior", "sigma_a")
pgm.add_edge("mu_a", "a")
pgm.add_edge("b_prior", "b")
pgm.add_edge("sigma_a", "a")
pgm.add_edge("sigma_prior", "sigma_y")
pgm.add_edge("sigma_y", "y_i")
pgm.add_edge("a", "y_i")
pgm.add_edge("b", "y_i")
pgm.add_plate(daft.Plate([1.4, 1.2, 1.2, 1.4], "$i = 1:85$"))
pgm.add_plate(daft.Plate([3.4, 0.2, 1.2, 1.4], "$i = 1:919$"))

pgm.render()
plt.show()
def varying_intercept_model(floor, county):
  """Creates a joint distribution for the varying intercept model."""
  return tfd.JointDistributionSequential([
      tfd.Normal(loc=0., scale=1e5),    # mu_a
      tfd.HalfCauchy(loc=0., scale=5),  # sigma_a
      lambda sigma_a, mu_a: tfd.MultivariateNormalDiag(  # a
          loc=affine(tf.ones([num_counties]), mu_a[..., tf.newaxis]),
          scale_identity_multiplier=sigma_a),
      tfd.Normal(loc=0., scale=1e5),    # b
      tfd.HalfCauchy(loc=0., scale=5),  # sigma_y
      lambda sigma_y, b, a: tfd.MultivariateNormalDiag(  # y
          loc=affine(floor, b[..., tf.newaxis], tf.gather(a, county, axis=-1)),
          scale_identity_multiplier=sigma_y)
  ])


def varying_intercept_log_prob(mu_a, sigma_a, a, b, sigma_y):
  """Computes joint log prob pinned at `log_radon`."""
  return varying_intercept_model(floor, county).log_prob(
      [mu_a, sigma_a, a, b, sigma_y, log_radon])
@tf.function
def sample_varying_intercepts(num_chains, num_results, num_burnin_steps):
  """Samples from the varying intercepts model."""
  hmc = tfp.mcmc.HamiltonianMonteCarlo(
      target_log_prob_fn=varying_intercept_log_prob,
      num_leapfrog_steps=10,
      step_size=0.01)

  initial_state = [
      tf.zeros([num_chains], name='init_mu_a'),
      tf.ones([num_chains], name='init_sigma_a'),
      tf.zeros([num_chains, num_counties], name='init_a'),
      tf.zeros([num_chains], name='init_b'),
      tf.ones([num_chains], name='init_sigma_y')
  ]
  unconstraining_bijectors = [
      tfb.Identity(),  # mu_a
      tfb.Exp(),       # sigma_a
      tfb.Identity(),  # a
      tfb.Identity(),  # b
      tfb.Exp()        # sigma_y
  ]
  kernel = tfp.mcmc.TransformedTransitionKernel(
      inner_kernel=hmc, bijector=unconstraining_bijectors)
  samples, kernel_results = tfp.mcmc.sample_chain(
      num_results=num_results,
      num_burnin_steps=num_burnin_steps,
      current_state=initial_state,
      kernel=kernel)

  acceptance_probs = tf.reduce_mean(
      tf.cast(kernel_results.inner_results.is_accepted, tf.float32), axis=0)

  return samples, acceptance_probs
VaryingInterceptsModel = collections.namedtuple(
    'VaryingInterceptsModel', ['mu_a', 'sigma_a', 'a', 'b', 'sigma_y'])

samples, acceptance_probs = sample_varying_intercepts(
    num_chains=4, num_results=1000, num_burnin_steps=1000)

print('Acceptance Probabilities: ', acceptance_probs.numpy())
varying_intercepts_samples = VaryingInterceptsModel._make(samples)
Acceptance Probabilities: [0.978 0.987 0.982 0.984]
for var in ['mu_a', 'sigma_a', 'b', 'sigma_y']:
  print(
      'R-hat for ', var, ': ',
      tfp.mcmc.potential_scale_reduction(
          getattr(varying_intercepts_samples, var)).numpy())
R-hat for  mu_a :  1.1099764
R-hat for  sigma_a :  1.1058794
R-hat for  b :  1.0448593
R-hat for  sigma_y :  1.0019052
varying_intercepts_estimates = LinearEstimates(
    sample_mean(varying_intercepts_samples.a),
    sample_mean(varying_intercepts_samples.b))
sample_counties = ('Lac Qui Parle', 'Aitkin', 'Koochiching', 'Douglas', 'Clay',
                   'Stearns', 'Ramsey', 'St Louis')
plot_estimates(
    linear_estimates=[
        unpooled_estimates, pooled_estimate, varying_intercepts_estimates
    ],
    labels=['Unpooled', 'Pooled', 'Varying Intercepts'],
    sample_counties=sample_counties)
def plot_posterior(var_name, var_samples):
  if isinstance(var_samples, tf.Tensor):
    var_samples = var_samples.numpy() # convert to numpy array

  fig = plt.figure(figsize=(10, 3))
  ax = fig.add_subplot(111)
  ax.hist(var_samples.flatten(), bins=40, edgecolor='white')
  sample_mean = var_samples.mean()
  ax.text(
      sample_mean,
      100,
      'mean={:.3f}'.format(sample_mean),
      color='white',
      fontsize=12)
  ax.set_xlabel('posterior of ' + var_name)
  plt.show()


plot_posterior('b', varying_intercepts_samples.b)
plot_posterior('sigma_a', varying_intercepts_samples.sigma_a)
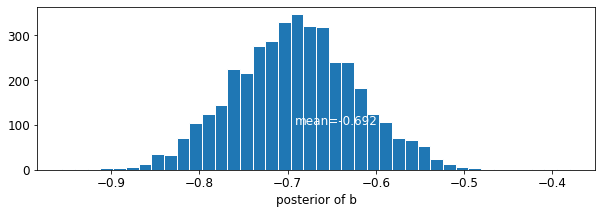
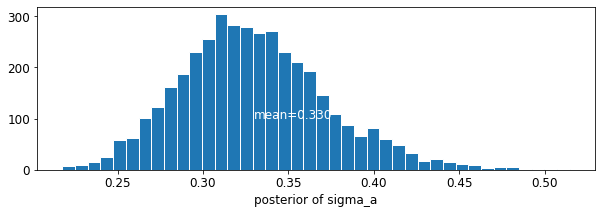
Оценка коэффициента пола составляет приблизительно -0,69, которые могут быть интерпретированы как дома без подвальных помещений , имеющих около половины (\(\exp(-0.69) = 0.50\)) уровни радона тех , с подвальными помещениями, после учета округа.
for var in ['b']:
  var_samples = getattr(varying_intercepts_samples, var)
  mean = var_samples.numpy().mean()
  std = var_samples.numpy().std()
  r_hat = tfp.mcmc.potential_scale_reduction(var_samples).numpy()
  n_eff = tfp.mcmc.effective_sample_size(var_samples).numpy().sum()

  print('var: ', var, ' mean: ', mean, ' std: ', std, ' n_eff: ', n_eff,
        ' r_hat: ', r_hat)
var: b mean: -0.6972574 std: 0.06966117 n_eff: 397.94327 r_hat: 1.0448593
def plot_intercepts_and_slopes(linear_estimates, title):
  xvals = np.arange(2)
  intercepts = np.ones([num_counties]) * linear_estimates.intercept
  slopes = np.ones([num_counties]) * linear_estimates.slope
  fig, ax = plt.subplots()
  for c in range(num_counties):
    ax.plot(xvals, intercepts[c] + slopes[c] * xvals, 'bo-', alpha=0.4)
  plt.xlim(-0.2, 1.2)
  ax.set_xticks([0, 1])
  ax.set_xticklabels(['Basement', 'First Floor'])
  ax.set_ylabel('Log Radon level')
  plt.title(title)
  plt.show()
plot_intercepts_and_slopes(varying_intercepts_estimates,
                           'Log Radon Estimates (Varying Intercepts)')
5.3 Различные склоны
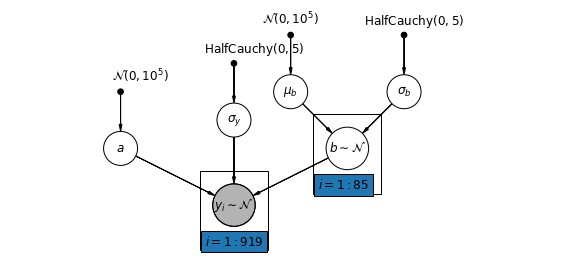
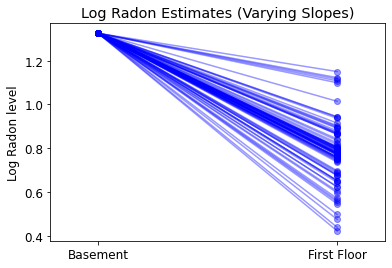
В качестве альтернативы мы можем создать модель, которая позволяет округам варьироваться в зависимости от того, как место измерения (подвал или первый этаж) влияет на показания радона. В этом случае перехват \(\alpha\) распределяется между странами.
\[y_i = \alpha + \beta_{j[i]} x_{i} + \epsilon_i\]
mpl.rc("font", size=12)
pgm = daft.PGM([10, 4.5], node_unit=1.2)
pgm.add_node(
    daft.Node(
        "mu_b_prior",
        r"$\mathcal{N}(0, 10^5)$",
        3.2,
        4,
        fixed=True,
        offset=(0, 5)))
pgm.add_node(
    daft.Node(
        "a_prior", r"$\mathcal{N}(0, 10^5)$", 2, 3, fixed=True, offset=(20, 5)))
pgm.add_node(daft.Node("a", r"$a$", 2, 2))

pgm.add_node(
    daft.Node(
        "sigma_prior",
        r"$\mathrm{HalfCauchy}(0, 5)$",
        4,
        3.5,
        fixed=True,
        offset=(20, 5)))
pgm.add_node(daft.Node("sigma_y", r"$\sigma_y$", 4, 2.5))

pgm.add_node(
    daft.Node(
        "mu_b_prior",
        r"$\mathcal{N}(0, 10^5)$",
        5,
        4,
        fixed=True,
        offset=(0, 5)))
pgm.add_node(
    daft.Node(
        "sigma_b_prior",
        r"$\mathrm{HalfCauchy}(0, 5)$",
        7,
        4,
        fixed=True,
        offset=(10, 5)))
pgm.add_node(daft.Node("mu_b", r"$\mu_b$", 5, 3))
pgm.add_node(daft.Node("sigma_b", r"$\sigma_b$", 7, 3))
pgm.add_node(daft.Node("b", r"$b \sim \mathcal{N}$", 6, 2, scale=1.25))

pgm.add_node(
    daft.Node(
        "y_i", r"$y_i \sim \mathcal{N}$", 4, 1, scale=1.25, observed=True))
pgm.add_edge("a_prior", "a")

pgm.add_edge("mu_b_prior", "mu_b")
pgm.add_edge("sigma_b_prior", "sigma_b")
pgm.add_edge("mu_b", "b")
pgm.add_edge("sigma_b", "b")

pgm.add_edge("sigma_prior", "sigma_y")

pgm.add_edge("sigma_y", "y_i")
pgm.add_edge("a", "y_i")
pgm.add_edge("b", "y_i")
pgm.add_plate(daft.Plate([5.4, 1.2, 1.2, 1.4], "$i = 1:85$"))
pgm.add_plate(daft.Plate([3.4, 0.2, 1.2, 1.4], "$i = 1:919$"))

pgm.render()
plt.show()
def varying_slopes_model(floor, county):
  """Creates a joint distribution for the varying slopes model."""
  return tfd.JointDistributionSequential([
      tfd.Normal(loc=0., scale=1e5),  # mu_b
      tfd.HalfCauchy(loc=0., scale=5),  # sigma_b
      tfd.Normal(loc=0., scale=1e5),  # a
      lambda _, sigma_b, mu_b: tfd.MultivariateNormalDiag(  # b
          loc=affine(tf.ones([num_counties]), mu_b[..., tf.newaxis]),
          scale_identity_multiplier=sigma_b),
      tfd.HalfCauchy(loc=0., scale=5),  # sigma_y
      lambda sigma_y, b, a: tfd.MultivariateNormalDiag(  # y
          loc=affine(floor, tf.gather(b, county, axis=-1), a[..., tf.newaxis]),
          scale_identity_multiplier=sigma_y)
  ])


def varying_slopes_log_prob(mu_b, sigma_b, a, b, sigma_y):
  return varying_slopes_model(floor, county).log_prob(
      [mu_b, sigma_b, a, b, sigma_y, log_radon])
@tf.function
def sample_varying_slopes(num_chains, num_results, num_burnin_steps):
  """Samples from the varying slopes model."""
  hmc = tfp.mcmc.HamiltonianMonteCarlo(
      target_log_prob_fn=varying_slopes_log_prob,
      num_leapfrog_steps=25,
      step_size=0.01)

  initial_state = [
      tf.zeros([num_chains], name='init_mu_b'),
      tf.ones([num_chains], name='init_sigma_b'),
      tf.zeros([num_chains], name='init_a'),
      tf.zeros([num_chains, num_counties], name='init_b'),
      tf.ones([num_chains], name='init_sigma_y')
  ]
  unconstraining_bijectors = [
      tfb.Identity(),  # mu_b
      tfb.Exp(),       # sigma_b
      tfb.Identity(),  # a
      tfb.Identity(),  # b
      tfb.Exp()        # sigma_y
  ]
  kernel = tfp.mcmc.TransformedTransitionKernel(
      inner_kernel=hmc, bijector=unconstraining_bijectors)
  samples, kernel_results = tfp.mcmc.sample_chain(
      num_results=num_results,
      num_burnin_steps=num_burnin_steps,
      current_state=initial_state,
      kernel=kernel)

  acceptance_probs = tf.reduce_mean(
      tf.cast(kernel_results.inner_results.is_accepted, tf.float32), axis=0)

  return samples, acceptance_probs
VaryingSlopesModel = collections.namedtuple(
    'VaryingSlopesModel', ['mu_b', 'sigma_b', 'a', 'b', 'sigma_y'])

samples, acceptance_probs = sample_varying_slopes(
    num_chains=4, num_results=1000, num_burnin_steps=1000)

print('Acceptance Probabilities: ', acceptance_probs.numpy())
varying_slopes_samples = VaryingSlopesModel._make(samples)
Acceptance Probabilities: [0.979 0.984 0.977 0.984]
for var in ['mu_b', 'sigma_b', 'a', 'sigma_y']:
  print(
      'R-hat for ', var, '\t: ',
      tfp.mcmc.potential_scale_reduction(getattr(varying_slopes_samples,
                                                 var)).numpy())
R-hat for  mu_b     :  1.0770341
R-hat for  sigma_b  :  1.0634488
R-hat for  a    :  1.0133665
R-hat for  sigma_y  :  1.0011941
varying_slopes_estimates = LinearEstimates(
    sample_mean(varying_slopes_samples.a),
    sample_mean(varying_slopes_samples.b))

plot_intercepts_and_slopes(varying_slopes_estimates,
                           'Log Radon Estimates (Varying Slopes)')
5.4 Различные пересечения и уклоны
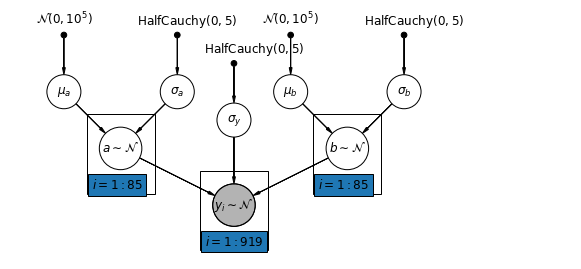
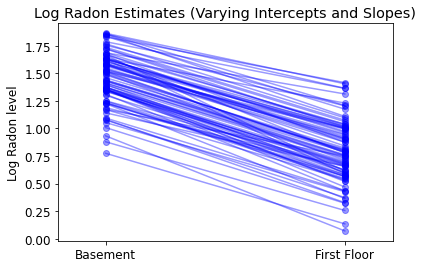
Самая общая модель позволяет изменять как точку пересечения, так и наклон в зависимости от округа:
\[y_i = \alpha_{j[i]} + \beta_{j[i]} x_{i} + \epsilon_i\]
mpl.rc("font", size=12)
pgm = daft.PGM([10, 4.5], node_unit=1.2)
pgm.add_node(
    daft.Node(
        "mu_a_prior",
        r"$\mathcal{N}(0, 10^5)$",
        1,
        4,
        fixed=True,
        offset=(0, 5)))
pgm.add_node(
    daft.Node(
        "sigma_a_prior",
        r"$\mathrm{HalfCauchy}(0, 5)$",
        3,
        4,
        fixed=True,
        offset=(10, 5)))
pgm.add_node(daft.Node("mu_a", r"$\mu_a$", 1, 3))
pgm.add_node(daft.Node("sigma_a", r"$\sigma_a$", 3, 3))
pgm.add_node(daft.Node("a", r"$a \sim \mathcal{N}$", 2, 2, scale=1.25))

pgm.add_node(
    daft.Node(
        "sigma_prior",
        r"$\mathrm{HalfCauchy}(0, 5)$",
        4,
        3.5,
        fixed=True,
        offset=(20, 5)))
pgm.add_node(daft.Node("sigma_y", r"$\sigma_y$", 4, 2.5))

pgm.add_node(
    daft.Node(
        "mu_b_prior",
        r"$\mathcal{N}(0, 10^5)$",
        5,
        4,
        fixed=True,
        offset=(0, 5)))
pgm.add_node(
    daft.Node(
        "sigma_b_prior",
        r"$\mathrm{HalfCauchy}(0, 5)$",
        7,
        4,
        fixed=True,
        offset=(10, 5)))
pgm.add_node(daft.Node("mu_b", r"$\mu_b$", 5, 3))
pgm.add_node(daft.Node("sigma_b", r"$\sigma_b$", 7, 3))
pgm.add_node(daft.Node("b", r"$b \sim \mathcal{N}$", 6, 2, scale=1.25))

pgm.add_node(
    daft.Node(
        "y_i", r"$y_i \sim \mathcal{N}$", 4, 1, scale=1.25, observed=True))
pgm.add_edge("mu_a_prior", "mu_a")
pgm.add_edge("sigma_a_prior", "sigma_a")
pgm.add_edge("mu_a", "a")
pgm.add_edge("sigma_a", "a")

pgm.add_edge("mu_b_prior", "mu_b")
pgm.add_edge("sigma_b_prior", "sigma_b")
pgm.add_edge("mu_b", "b")
pgm.add_edge("sigma_b", "b")

pgm.add_edge("sigma_prior", "sigma_y")

pgm.add_edge("sigma_y", "y_i")
pgm.add_edge("a", "y_i")
pgm.add_edge("b", "y_i")
pgm.add_plate(daft.Plate([1.4, 1.2, 1.2, 1.4], "$i = 1:85$"))
pgm.add_plate(daft.Plate([5.4, 1.2, 1.2, 1.4], "$i = 1:85$"))
pgm.add_plate(daft.Plate([3.4, 0.2, 1.2, 1.4], "$i = 1:919$"))

pgm.render()
plt.show()
def varying_intercepts_and_slopes_model(floor, county):
  """Creates a joint distribution for the varying slope model."""
  return tfd.JointDistributionSequential([
      tfd.Normal(loc=0., scale=1e5),    # mu_a
      tfd.HalfCauchy(loc=0., scale=5),  # sigma_a
      tfd.Normal(loc=0., scale=1e5),    # mu_b
      tfd.HalfCauchy(loc=0., scale=5),  # sigma_b
      lambda sigma_b, mu_b, sigma_a, mu_a: tfd.MultivariateNormalDiag(  # a
          loc=affine(tf.ones([num_counties]), mu_a[..., tf.newaxis]),
          scale_identity_multiplier=sigma_a),
      lambda _, sigma_b, mu_b: tfd.MultivariateNormalDiag(  # b
          loc=affine(tf.ones([num_counties]), mu_b[..., tf.newaxis]),
          scale_identity_multiplier=sigma_b),
      tfd.HalfCauchy(loc=0., scale=5),  # sigma_y
      lambda sigma_y, b, a: tfd.MultivariateNormalDiag(  # y
          loc=affine(floor, tf.gather(b, county, axis=-1),
                     tf.gather(a, county, axis=-1)),
          scale_identity_multiplier=sigma_y)
  ])


@tf.function
def varying_intercepts_and_slopes_log_prob(mu_a, sigma_a, mu_b, sigma_b, a, b,
                                           sigma_y):
  """Computes joint log prob pinned at `log_radon`."""
  return varying_intercepts_and_slopes_model(floor, county).log_prob(
      [mu_a, sigma_a, mu_b, sigma_b, a, b, sigma_y, log_radon])
@tf.function
def sample_varying_intercepts_and_slopes(num_chains, num_results,
                                         num_burnin_steps):
  """Samples from the varying intercepts and slopes model."""
  hmc = tfp.mcmc.HamiltonianMonteCarlo(
      target_log_prob_fn=varying_intercepts_and_slopes_log_prob,
      num_leapfrog_steps=50,
      step_size=0.01)

  initial_state = [
      tf.zeros([num_chains], name='init_mu_a'),
      tf.ones([num_chains], name='init_sigma_a'),
      tf.zeros([num_chains], name='init_mu_b'),
      tf.ones([num_chains], name='init_sigma_b'),
      tf.zeros([num_chains, num_counties], name='init_a'),
      tf.zeros([num_chains, num_counties], name='init_b'),
      tf.ones([num_chains], name='init_sigma_y')
  ]
  unconstraining_bijectors = [
      tfb.Identity(),  # mu_a
      tfb.Exp(),       # sigma_a
      tfb.Identity(),  # mu_b
      tfb.Exp(),       # sigma_b
      tfb.Identity(),  # a
      tfb.Identity(),  # b
      tfb.Exp()        # sigma_y
  ]
  kernel = tfp.mcmc.TransformedTransitionKernel(
      inner_kernel=hmc, bijector=unconstraining_bijectors)
  samples, kernel_results = tfp.mcmc.sample_chain(
      num_results=num_results,
      num_burnin_steps=num_burnin_steps,
      current_state=initial_state,
      kernel=kernel)

  acceptance_probs = tf.reduce_mean(
      tf.cast(kernel_results.inner_results.is_accepted, tf.float32), axis=0)

  return samples, acceptance_probs
VaryingInterceptsAndSlopesModel = collections.namedtuple(
    'VaryingInterceptsAndSlopesModel',
    ['mu_a', 'sigma_a', 'mu_b', 'sigma_b', 'a', 'b', 'sigma_y'])

samples, acceptance_probs = sample_varying_intercepts_and_slopes(
    num_chains=4, num_results=1000, num_burnin_steps=500)

print('Acceptance Probabilities: ', acceptance_probs.numpy())
varying_intercepts_and_slopes_samples = VaryingInterceptsAndSlopesModel._make(
    samples)
Acceptance Probabilities: [0.988 0.985 0.992 0.938]
for var in ['mu_a', 'sigma_a', 'mu_b', 'sigma_b']:
  print(
      'R-hat for ', var, '\t: ',
      tfp.mcmc.potential_scale_reduction(
          getattr(varying_intercepts_and_slopes_samples, var)).numpy())
R-hat for  mu_a     :  1.010764
R-hat for  sigma_a  :  1.0078123
R-hat for  mu_b     :  1.0279609
R-hat for  sigma_b  :  1.3165458
varying_intercepts_and_slopes_estimates = LinearEstimates(
    sample_mean(varying_intercepts_and_slopes_samples.a),
    sample_mean(varying_intercepts_and_slopes_samples.b))

plot_intercepts_and_slopes(
    varying_intercepts_and_slopes_estimates,
    'Log Radon Estimates (Varying Intercepts and Slopes)')
forest_plot(
    num_chains=4,
    num_vars=num_counties,
    var_name='a',
    var_labels=county_name,
    samples=varying_intercepts_and_slopes_samples.a.numpy())
forest_plot(
    num_chains=4,
    num_vars=num_counties,
    var_name='b',
    var_labels=county_name,
    samples=varying_intercepts_and_slopes_samples.b.numpy())
6 Добавление предикторов на уровне группы
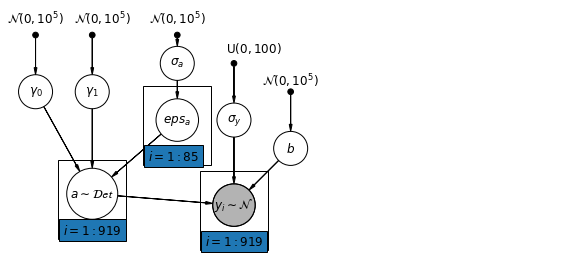
Основное преимущество многоуровневых моделей - это возможность одновременно обрабатывать предикторы на нескольких уровнях. Если мы рассмотрим модель с переменными перехватами, приведенную выше:
\(y_i = \alpha_{j[i]} + \beta x_{i} + \epsilon_i\) мы можем, вместо простого случайного эффекта , чтобы описать изменение в ожидаемой величине радона, укажите другую модель регрессии с коварьировать уездную. Здесь мы используем уездный уран для чтения \(u_j\), которая , как полагают, связаны с радоновыми уровнях:
\(\alpha_j = \gamma_0 + \gamma_1 u_j + \zeta_j\)\(\zeta_j \sim N(0, \sigma_{\alpha}^2)\) Таким образом, мы в настоящее время включения в доме уровень предсказателя (пол или подвал), а также предсказатель уездного уровня (уран).
Обратите внимание, что в модели есть обе индикаторные переменные для каждого округа, а также ковариата на уровне округа. В классической регрессии это привело бы к коллинеарности. В многоуровневой модели частичное объединение перехватов в сторону ожидаемого значения линейной модели на уровне группы позволяет избежать этого.
Предикторы на уровне группы также служат для уменьшения вариации на уровне группы\(\sigma_{\alpha}\). Важным следствием этого является то, что оценка на уровне группы способствует более сильному объединению.
6.1 Модель иерархических перехватов
mpl.rc("font", size=12)
pgm = daft.PGM([10, 4.5], node_unit=1.2)
pgm.add_node(
    daft.Node(
        "gamma_0_prior",
        r"$\mathcal{N}(0, 10^5)$",
        0.5,
        4,
        fixed=True,
        offset=(0, 5)))
pgm.add_node(
    daft.Node(
        "gamma_1_prior",
        r"$\mathcal{N}(0, 10^5)$",
        1.5,
        4,
        fixed=True,
        offset=(10, 5)))
pgm.add_node(daft.Node("gamma_0", r"$\gamma_0$", 0.5, 3))
pgm.add_node(daft.Node("gamma_1", r"$\gamma_1$", 1.5, 3))
pgm.add_node(
    daft.Node(
        "sigma_a_prior",
        r"$\mathcal{N}(0, 10^5)$",
        3,
        4,
        fixed=True,
        offset=(0, 5)))
pgm.add_node(daft.Node("sigma_a", r"$\sigma_a$", 3, 3.5))
pgm.add_node(daft.Node("eps_a", r"$eps_a$", 3, 2.5, scale=1.25))
pgm.add_node(daft.Node("a", r"$a \sim \mathcal{Det}$", 1.5, 1.2, scale=1.5))

pgm.add_node(
    daft.Node(
        "sigma_prior",
        r"$\mathrm{U}(0, 100)$",
        4,
        3.5,
        fixed=True,
        offset=(20, 5)))
pgm.add_node(daft.Node("sigma_y", r"$\sigma_y$", 4, 2.5))
pgm.add_node(daft.Node("b_prior", r"$\mathcal{N}(0, 10^5)$", 5, 3, fixed=True))
pgm.add_node(daft.Node("b", r"$b$", 5, 2))

pgm.add_node(
    daft.Node(
        "y_i", r"$y_i \sim \mathcal{N}$", 4, 1, scale=1.25, observed=True))

pgm.add_edge("gamma_0_prior", "gamma_0")
pgm.add_edge("gamma_1_prior", "gamma_1")
pgm.add_edge("sigma_a_prior", "sigma_a")
pgm.add_edge("sigma_a", "eps_a")
pgm.add_edge("gamma_0", "a")
pgm.add_edge("gamma_1", "a")
pgm.add_edge("eps_a", "a")

pgm.add_edge("b_prior", "b")
pgm.add_edge("sigma_prior", "sigma_y")

pgm.add_edge("sigma_y", "y_i")
pgm.add_edge("a", "y_i")
pgm.add_edge("b", "y_i")
pgm.add_plate(daft.Plate([2.4, 1.7, 1.2, 1.4], "$i = 1:85$"))
pgm.add_plate(daft.Plate([0.9, 0.4, 1.2, 1.4], "$i = 1:919$"))
pgm.add_plate(daft.Plate([3.4, 0.2, 1.2, 1.4], "$i = 1:919$"))

pgm.render()
plt.show()
def hierarchical_intercepts_model(floor, county, log_uranium):
  """Creates a joint distribution for the varying slope model."""
  return tfd.JointDistributionSequential([
      tfd.HalfCauchy(loc=0., scale=5),  # sigma_a
      lambda sigma_a: tfd.MultivariateNormalDiag(  # eps_a
          loc=tf.zeros([num_counties]),
          scale_identity_multiplier=sigma_a),
      tfd.Normal(loc=0., scale=1e5),  # gamma_0
      tfd.Normal(loc=0., scale=1e5),  # gamma_1
      tfd.Normal(loc=0., scale=1e5),  # b
      tfd.Uniform(low=0., high=100),  # sigma_y
      lambda sigma_y, b, gamma_1, gamma_0, eps_a: tfd.
      MultivariateNormalDiag(  # y
          loc=affine(
              floor, b[..., tf.newaxis],
              affine(log_uranium, gamma_1[..., tf.newaxis],
                     gamma_0[..., tf.newaxis]) + tf.gather(eps_a, county, axis=-1)),
          scale_identity_multiplier=sigma_y)
  ])


def hierarchical_intercepts_log_prob(sigma_a, eps_a, gamma_0, gamma_1, b,
                                     sigma_y):
  """Computes joint log prob pinned at `log_radon`."""
  return hierarchical_intercepts_model(floor, county, log_uranium).log_prob(
      [sigma_a, eps_a, gamma_0, gamma_1, b, sigma_y, log_radon])
@tf.function
def sample_hierarchical_intercepts(num_chains, num_results, num_burnin_steps):
  """Samples from the hierarchical intercepts model."""
  hmc = tfp.mcmc.HamiltonianMonteCarlo(
      target_log_prob_fn=hierarchical_intercepts_log_prob,
      num_leapfrog_steps=10,
      step_size=0.01)

  initial_state = [
      tf.ones([num_chains], name='init_sigma_a'),
      tf.zeros([num_chains, num_counties], name='eps_a'),
      tf.zeros([num_chains], name='init_gamma_0'),
      tf.zeros([num_chains], name='init_gamma_1'),
      tf.zeros([num_chains], name='init_b'),
      tf.ones([num_chains], name='init_sigma_y')
  ]
  unconstraining_bijectors = [
      tfb.Exp(),       # sigma_a
      tfb.Identity(),  # eps_a
      tfb.Identity(),  # gamma_0
      tfb.Identity(),  # gamma_0
      tfb.Identity(),  # b
      # Maps reals to [0, 100].
      tfb.Chain([tfb.Shift(shift=50.),
                 tfb.Scale(scale=50.),
                 tfb.Tanh()])  # sigma_y
  ]
  kernel = tfp.mcmc.TransformedTransitionKernel(
      inner_kernel=hmc, bijector=unconstraining_bijectors)
  samples, kernel_results = tfp.mcmc.sample_chain(
      num_results=num_results,
      num_burnin_steps=num_burnin_steps,
      current_state=initial_state,
      kernel=kernel)

  acceptance_probs = tf.reduce_mean(
      tf.cast(kernel_results.inner_results.is_accepted, tf.float32), axis=0)

  return samples, acceptance_probs
HierarchicalInterceptsModel = collections.namedtuple(
    'HierarchicalInterceptsModel',
    ['sigma_a', 'eps_a', 'gamma_0', 'gamma_1', 'b', 'sigma_y'])

samples, acceptance_probs = sample_hierarchical_intercepts(
    num_chains=4, num_results=2000, num_burnin_steps=500)
print('Acceptance Probabilities: ', acceptance_probs.numpy())
hierarchical_intercepts_samples = HierarchicalInterceptsModel._make(samples)
Acceptance Probabilities: [0.9615 0.941 0.955 0.95 ]
for var in ['sigma_a', 'gamma_0', 'gamma_1', 'b', 'sigma_y']:
  print(
      'R-hat for', var, ':',
      tfp.mcmc.potential_scale_reduction(
          getattr(hierarchical_intercepts_samples, var)).numpy())
R-hat for sigma_a : 1.0469627
R-hat for gamma_0 : 1.0016835
R-hat for gamma_1 : 1.0097923
R-hat for b : 1.0014259
R-hat for sigma_y : 1.0025403
def plot_hierarchical_intercepts():
  mean_and_var = lambda x : [reduce_samples(x, fn) for fn in [np.mean, np.var]]
  gamma_0_mean, gamma_0_var = mean_and_var(
    hierarchical_intercepts_samples.gamma_0)
  gamma_1_mean, gamma_1_var = mean_and_var(
    hierarchical_intercepts_samples.gamma_1)
  eps_a_means, eps_a_vars  = mean_and_var(hierarchical_intercepts_samples.eps_a)

  mu_a_means = gamma_0_mean + gamma_1_mean * log_uranium
  mu_a_vars = gamma_0_var + np.square(log_uranium) * gamma_1_var
  a_means = mu_a_means + eps_a_means[county]
  a_stds = np.sqrt(mu_a_vars + eps_a_vars[county])

  plt.figure()
  plt.scatter(log_uranium, a_means, marker='.', c='C0')
  xvals = np.linspace(-1, 0.8)
  plt.plot(xvals,gamma_0_mean + gamma_1_mean * xvals, 'k--')
  plt.xlim(-1, 0.8)

  for ui, m, se in zip(log_uranium, a_means, a_stds):
    plt.plot([ui, ui], [m - se, m + se], 'C1-', alpha=0.1)
  plt.xlabel('County-level uranium')
  plt.ylabel('Intercept estimate')


plot_hierarchical_intercepts()
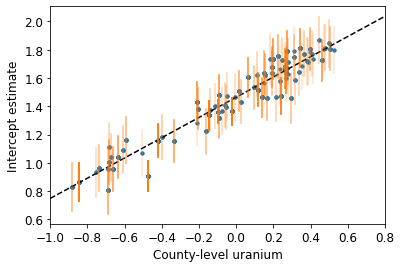
Стандартные ошибки на перехватах уже, чем для модели частичного объединения без ковариаты на уровне округа.
6.2 Корреляции между уровнями
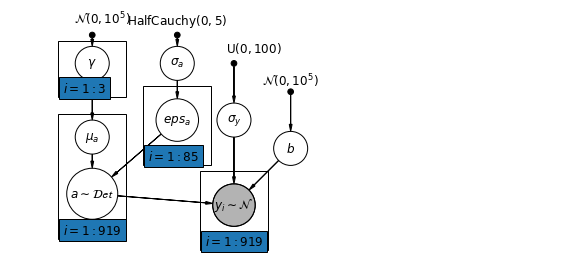
В некоторых случаях наличие предикторов на нескольких уровнях может выявить корреляцию между переменными индивидуального уровня и групповыми остатками. Мы можем учесть это, включив среднее значение отдельных предикторов в качестве ковариаты в модель для группового пересечения.
\(\alpha_j = \gamma_0 + \gamma_1 u_j + \gamma_2 \bar{x} + \zeta_j\) Они широко называют контекстуальных эффектов.
mpl.rc("font", size=12)
pgm = daft.PGM([10, 4.5], node_unit=1.2)
pgm.add_node(
    daft.Node(
        "gamma_prior",
        r"$\mathcal{N}(0, 10^5)$",
        1.5,
        4,
        fixed=True,
        offset=(10, 5)))
pgm.add_node(daft.Node("gamma", r"$\gamma$", 1.5, 3.5))
pgm.add_node(daft.Node("mu_a", r"$\mu_a$", 1.5, 2.2))
pgm.add_node(
    daft.Node(
        "sigma_a_prior",
        r"$\mathrm{HalfCauchy}(0, 5)$",
        3,
        4,
        fixed=True,
        offset=(0, 5)))
pgm.add_node(daft.Node("sigma_a", r"$\sigma_a$", 3, 3.5))
pgm.add_node(daft.Node("eps_a", r"$eps_a$", 3, 2.5, scale=1.25))
pgm.add_node(daft.Node("a", r"$a \sim \mathcal{Det}$", 1.5, 1.2, scale=1.5))

pgm.add_node(
    daft.Node(
        "sigma_prior",
        r"$\mathrm{U}(0, 100)$",
        4,
        3.5,
        fixed=True,
        offset=(20, 5)))
pgm.add_node(daft.Node("sigma_y", r"$\sigma_y$", 4, 2.5))
pgm.add_node(daft.Node("b_prior", r"$\mathcal{N}(0, 10^5)$", 5, 3, fixed=True))
pgm.add_node(daft.Node("b", r"$b$", 5, 2))

pgm.add_node(
    daft.Node(
        "y_i", r"$y_i \sim \mathcal{N}$", 4, 1, scale=1.25, observed=True))

pgm.add_edge("gamma_prior", "gamma")
pgm.add_edge("sigma_a_prior", "sigma_a")
pgm.add_edge("sigma_a", "eps_a")
pgm.add_edge("gamma", "mu_a")
pgm.add_edge("mu_a", "a")
pgm.add_edge("eps_a", "a")

pgm.add_edge("b_prior", "b")
pgm.add_edge("sigma_prior", "sigma_y")

pgm.add_edge("sigma_y", "y_i")
pgm.add_edge("a", "y_i")
pgm.add_edge("b", "y_i")
pgm.add_plate(daft.Plate([0.9, 2.9, 1.2, 1.0], "$i = 1:3$"))
pgm.add_plate(daft.Plate([2.4, 1.7, 1.2, 1.4], "$i = 1:85$"))
pgm.add_plate(daft.Plate([0.9, 0.4, 1.2, 2.2], "$i = 1:919$"))
pgm.add_plate(daft.Plate([3.4, 0.2, 1.2, 1.4], "$i = 1:919$"))

pgm.render()
plt.show()
# Create a new variable for mean of floor across counties
xbar = tf.convert_to_tensor(radon.groupby('county')['floor'].mean(), tf.float32)
xbar = tf.gather(xbar, county, axis=-1)
def contextual_effects_model(floor, county, log_uranium, xbar):
  """Creates a joint distribution for the varying slope model."""
  return tfd.JointDistributionSequential([
      tfd.HalfCauchy(loc=0., scale=5),  # sigma_a
      lambda sigma_a: tfd.MultivariateNormalDiag(  # eps_a
          loc=tf.zeros([num_counties]),
          scale_identity_multiplier=sigma_a),
      tfd.Normal(loc=0., scale=1e5),  # gamma_0
      tfd.Normal(loc=0., scale=1e5),  # gamma_1
      tfd.Normal(loc=0., scale=1e5),  # gamma_2
      tfd.Normal(loc=0., scale=1e5),  # b
      tfd.Uniform(low=0., high=100),  # sigma_y
      lambda sigma_y, b, gamma_2, gamma_1, gamma_0, eps_a: tfd.
      MultivariateNormalDiag(  # y
          loc=affine(
              floor, b[..., tf.newaxis],
              affine(log_uranium, gamma_1[..., tf.newaxis], gamma_0[
                  ..., tf.newaxis]) + affine(xbar, gamma_2[..., tf.newaxis]) +
              tf.gather(eps_a, county, axis=-1)),
          scale_identity_multiplier=sigma_y)
  ])


def contextual_effects_log_prob(sigma_a, eps_a, gamma_0, gamma_1, gamma_2, b,
                                sigma_y):
  """Computes joint log prob pinned at `log_radon`."""
  return contextual_effects_model(floor, county, log_uranium, xbar).log_prob(
      [sigma_a, eps_a, gamma_0, gamma_1, gamma_2, b, sigma_y, log_radon])
@tf.function
def sample_contextual_effects(num_chains, num_results, num_burnin_steps):
  """Samples from the hierarchical intercepts model."""
  hmc = tfp.mcmc.HamiltonianMonteCarlo(
      target_log_prob_fn=contextual_effects_log_prob,
      num_leapfrog_steps=10,
      step_size=0.01)

  initial_state = [
      tf.ones([num_chains], name='init_sigma_a'),
      tf.zeros([num_chains, num_counties], name='eps_a'),
      tf.zeros([num_chains], name='init_gamma_0'),
      tf.zeros([num_chains], name='init_gamma_1'),
      tf.zeros([num_chains], name='init_gamma_2'),
      tf.zeros([num_chains], name='init_b'),
      tf.ones([num_chains], name='init_sigma_y')
  ]
  unconstraining_bijectors = [
      tfb.Exp(),       # sigma_a
      tfb.Identity(),  # eps_a
      tfb.Identity(),  # gamma_0
      tfb.Identity(),  # gamma_1
      tfb.Identity(),  # gamma_2
      tfb.Identity(),  # b
      tfb.Chain([tfb.Shift(shift=50.),
                 tfb.Scale(scale=50.),
                 tfb.Tanh()])  # sigma_y
  ]
  kernel = tfp.mcmc.TransformedTransitionKernel(
      inner_kernel=hmc, bijector=unconstraining_bijectors)
  samples, kernel_results = tfp.mcmc.sample_chain(
      num_results=num_results,
      num_burnin_steps=num_burnin_steps,
      current_state=initial_state,
      kernel=kernel)

  acceptance_probs = tf.reduce_mean(
      tf.cast(kernel_results.inner_results.is_accepted, tf.float32), axis=0)

  return samples, acceptance_probs
ContextualEffectsModel = collections.namedtuple(
    'ContextualEffectsModel',
    ['sigma_a', 'eps_a', 'gamma_0', 'gamma_1', 'gamma_2', 'b', 'sigma_y'])

samples, acceptance_probs = sample_contextual_effects(
    num_chains=4, num_results=2000, num_burnin_steps=500)
print('Acceptance Probabilities: ', acceptance_probs.numpy())
contextual_effects_samples = ContextualEffectsModel._make(samples)
Acceptance Probabilities: [0.9505 0.9595 0.951 0.9535]
for var in ['sigma_a', 'gamma_0', 'gamma_1', 'gamma_2', 'b', 'sigma_y']:
  print(
      'R-hat for ', var, ': ',
      tfp.mcmc.potential_scale_reduction(
          getattr(contextual_effects_samples, var)).numpy())
R-hat for  sigma_a :  1.0709597
R-hat for  gamma_0 :  1.0067923
R-hat for  gamma_1 :  1.0089629
R-hat for  gamma_2 :  1.0054177
R-hat for  b :  1.0018929
R-hat for  sigma_y :  1.0032713
for var in ['gamma_0', 'gamma_1', 'gamma_2']:
  var_samples = getattr(contextual_effects_samples, var)
  mean = var_samples.numpy().mean()
  std = var_samples.numpy().std()
  r_hat = tfp.mcmc.potential_scale_reduction(var_samples).numpy()
  n_eff = tfp.mcmc.effective_sample_size(var_samples).numpy().sum()

  print(var, ' mean: ', mean, ' std: ', std, ' n_eff: ', n_eff, ' r_hat: ',
        r_hat)
gamma_0  mean:  1.3934746  std:  0.04966602  n_eff:  816.21265  r_hat:  1.0067923
gamma_1  mean:  0.7229424  std:  0.088611916  n_eff:  1462.486  r_hat:  1.0089629
gamma_2  mean:  0.40893936  std:  0.20304097  n_eff:  457.8165  r_hat:  1.0054177
Таким образом, из этого можно сделать вывод, что в округах с более высокой долей домов без подвалов, как правило, наблюдаются более высокие базовые уровни радона. Возможно, это связано с типом почвы, который, в свою очередь, может повлиять на тип возводимых конструкций.
6.3 Прогнозирование
Гельман (2006) использовал тесты перекрестной проверки, чтобы проверить ошибку прогноза для моделей с объединенными, объединенными и частично объединенными моделями.
Среднеквадратичные ошибки прогноза перекрестной проверки:
- без объединения = 0,86
- объединенный = 0,84
- многоуровневый = 0,79
Есть два типа прогнозов, которые могут быть сделаны в многоуровневой модели:
- Новый человек в существующей группе
- Новый человек в новой группе
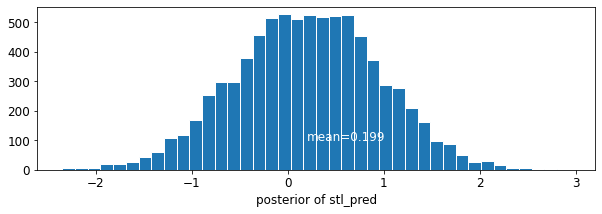
Например, если мы хотим сделать прогноз для нового дома без подвала в округе Сент-Луис, нам просто нужно выполнить выборку из модели радона с соответствующей точкой пересечения.
county_name.index('St Louis')
69
Это,
\[\tilde{y}_i \sim N(\alpha_{69} + \beta (x_i=1), \sigma_y^2)\]
st_louis_log_uranium = tf.convert_to_tensor(
    radon.where(radon['county'] == 69)['log_uranium_ppm'].mean(), tf.float32)
st_louis_xbar = tf.convert_to_tensor(
    radon.where(radon['county'] == 69)['floor'].mean(), tf.float32)
@tf.function
def intercept_a(gamma_0, gamma_1, gamma_2, eps_a, log_uranium, xbar, county):
  return (affine(log_uranium, gamma_1, gamma_0) + affine(xbar, gamma_2) +
          tf.gather(eps_a, county, axis=-1))


def contextual_effects_predictive_model(floor, county, log_uranium, xbar,
                                        st_louis_log_uranium, st_louis_xbar):
  """Creates a joint distribution for the contextual effects model."""
  return tfd.JointDistributionSequential([
      tfd.HalfCauchy(loc=0., scale=5),  # sigma_a
      lambda sigma_a: tfd.MultivariateNormalDiag(  # eps_a
          loc=tf.zeros([num_counties]),
          scale_identity_multiplier=sigma_a),
      tfd.Normal(loc=0., scale=1e5),  # gamma_0
      tfd.Normal(loc=0., scale=1e5),  # gamma_1
      tfd.Normal(loc=0., scale=1e5),  # gamma_2
      tfd.Normal(loc=0., scale=1e5),  # b
      tfd.Uniform(low=0., high=100),  # sigma_y
      # y
      lambda sigma_y, b, gamma_2, gamma_1, gamma_0, eps_a: (
        tfd.MultivariateNormalDiag(
          loc=affine(
              floor, b[..., tf.newaxis],
              intercept_a(gamma_0[..., tf.newaxis],
                          gamma_1[..., tf.newaxis], gamma_2[..., tf.newaxis],
                          eps_a, log_uranium, xbar, county)),
          scale_identity_multiplier=sigma_y)),
      # stl_pred
      lambda _, sigma_y, b, gamma_2, gamma_1, gamma_0, eps_a: tfd.Normal(
          loc=intercept_a(gamma_0, gamma_1, gamma_2, eps_a,
                          st_louis_log_uranium, st_louis_xbar, 69) + b,
          scale=sigma_y)
  ])


@tf.function
def contextual_effects_predictive_log_prob(sigma_a, eps_a, gamma_0, gamma_1,
                                           gamma_2, b, sigma_y, stl_pred):
  """Computes joint log prob pinned at `log_radon`."""
  return contextual_effects_predictive_model(floor, county, log_uranium, xbar,
                                             st_louis_log_uranium,
                                             st_louis_xbar).log_prob([
                                                 sigma_a, eps_a, gamma_0,
                                                 gamma_1, gamma_2, b, sigma_y,
                                                 log_radon, stl_pred
                                             ])
@tf.function
def sample_contextual_effects_predictive(num_chains, num_results,
                                         num_burnin_steps):
  """Samples from the contextual effects predictive model."""
  hmc = tfp.mcmc.HamiltonianMonteCarlo(
      target_log_prob_fn=contextual_effects_predictive_log_prob,
      num_leapfrog_steps=50,
      step_size=0.01)

  initial_state = [
      tf.ones([num_chains], name='init_sigma_a'),
      tf.zeros([num_chains, num_counties], name='eps_a'),
      tf.zeros([num_chains], name='init_gamma_0'),
      tf.zeros([num_chains], name='init_gamma_1'),
      tf.zeros([num_chains], name='init_gamma_2'),
      tf.zeros([num_chains], name='init_b'),
      tf.ones([num_chains], name='init_sigma_y'),
      tf.zeros([num_chains], name='init_stl_pred')
  ]
  unconstraining_bijectors = [
      tfb.Exp(),       # sigma_a
      tfb.Identity(),  # eps_a
      tfb.Identity(),  # gamma_0
      tfb.Identity(),  # gamma_1
      tfb.Identity(),  # gamma_2
      tfb.Identity(),  # b
      tfb.Chain([tfb.Shift(shift=50.),
                 tfb.Scale(scale=50.),
                 tfb.Tanh()]),  # sigma_y
      tfb.Identity(),  # stl_pred
  ]
  kernel = tfp.mcmc.TransformedTransitionKernel(
      inner_kernel=hmc, bijector=unconstraining_bijectors)
  samples, kernel_results = tfp.mcmc.sample_chain(
      num_results=num_results,
      num_burnin_steps=num_burnin_steps,
      current_state=initial_state,
      kernel=kernel)

  acceptance_probs = tf.reduce_mean(
      tf.cast(kernel_results.inner_results.is_accepted, tf.float32), axis=0)

  return samples, acceptance_probs
ContextualEffectsPredictiveModel = collections.namedtuple(
    'ContextualEffectsPredictiveModel', [
        'sigma_a', 'eps_a', 'gamma_0', 'gamma_1', 'gamma_2', 'b', 'sigma_y',
        'stl_pred'
    ])

samples, acceptance_probs = sample_contextual_effects_predictive(
    num_chains=4, num_results=2000, num_burnin_steps=500)
print('Acceptance Probabilities: ', acceptance_probs.numpy())
contextual_effects_pred_samples = ContextualEffectsPredictiveModel._make(
    samples)
Acceptance Probabilities: [0.9165 0.978 0.9755 0.9785]
for var in [
    'sigma_a', 'gamma_0', 'gamma_1', 'gamma_2', 'b', 'sigma_y', 'stl_pred'
]:
  print(
      'R-hat for ', var, ': ',
      tfp.mcmc.potential_scale_reduction(
          getattr(contextual_effects_pred_samples, var)).numpy())
R-hat for  sigma_a :  1.0325582
R-hat for  gamma_0 :  1.0033548
R-hat for  gamma_1 :  1.0011047
R-hat for  gamma_2 :  1.001153
R-hat for  b :  1.0020066
R-hat for  sigma_y :  1.0128921
R-hat for  stl_pred :  1.0058256
plot_traces('stl_pred', contextual_effects_pred_samples.stl_pred, num_chains=4)

plot_posterior('stl_pred', contextual_effects_pred_samples.stl_pred)
7 Выводы
Преимущества многоуровневых моделей:
- Учет естественной иерархической структуры данных наблюдений.
- Оценка коэффициентов для (недостаточно представленных) групп.
- Включение информации на индивидуальном и групповом уровнях при оценке коэффициентов на уровне группы.
- Учет различий между коэффициентами индивидуального уровня в группах.
использованная литература
Гельман А. и Хилл Дж. (2006). Анализ данных с использованием регрессии и многоуровневых / иерархических моделей (1-е изд.). Издательство Кембриджского университета.
Гельман, А. (2006). Многоуровневое (иерархическое) моделирование: что можно, а что нельзя. Технометрика, 48 (3), 432–435.
