この例は、PyMC3 サンプルノートブック A Primer on Bayesian Methods for Multilevel Modeling (マルチレベルモデリングのためのベイズ法の入門書) から一部を抜粋したものです。
 TensorFlow.org で表示 TensorFlow.org で表示 |
 Google Colab で実行 Google Colab で実行 |
 GitHub でソースを表示 GitHub でソースを表示 |
 ノートブックをダウンロード ノートブックをダウンロード |
依存関係と前提条件
Import
import collections
import os
from six.moves import urllib
import daft as daft
import matplotlib as mpl
import matplotlib.pyplot as plt
import numpy as np
import pandas as pd
import seaborn as sns
import warnings

import tensorflow.compat.v2 as tf
tf.enable_v2_behavior()

import tensorflow_datasets as tfds
import tensorflow_probability as tfp

tfk = tf.keras
tfkl = tf.keras.layers
tfpl = tfp.layers
tfd = tfp.distributions
tfb = tfp.bijectors

warnings.simplefilter('ignore')
1 はじめに
このコラボでは、人気のあるラドンデータセットを使用して、さまざまな複雑さの階層線形モデル (HLM) を適合させます。ここでは、TFP プリミティブとそのマルコフ連鎖モンテカルロツールセットを利用します。
データをより適切に適合させるためには、データセットに存在する自然な階層構造を利用します。従来のアプローチで完全にプールされたモデルとプールされていないモデルから始めます。次にマルチレベルモデルで部分的なプーリングモデル、グループレベルの予測子、およびコンテキスト効果を調査します。
また、TFP でラドンデータセットを使用して HLM を適合させる関連ノートブックについては、TF Probability、R、Stan を使用した線形混合効果回帰 を参照してください。
ここで取り上げている内容について質問がある場合は、TensorFlow Probability メーリングリストに連絡してください。または、メーリングリスに参加してください。喜んでお手伝いさせていただきます。
2 マルチレベルモデリングの概要
マルチレベルモデリングのためのベイズ法の入門書
階層的またはマルチレベルモデリングは、一般化された回帰モデリングです。
マルチレベルモデルは、構成モデルのパラメータに確率分布が与えられる回帰モデルです。これは、モデルパラメータがグループごとに異なることが許可されていることを意味します。多くの場合、観測ユニットは自然にクラスタ化されます。クラスタリングは、クラスタのランダムサンプリングとクラスタ内のランダムサンプリングにもかかわらず、観測値間の依存関係を引き起こします。
階層モデルは、パラメータが相互にネストされている特定のマルチレベルモデルです。一部のマルチレベル構造は階層的ではありません。
例えば「国」と「年」はネストされていませんが、別個の重複するパラメータのクラスタを表す場合があります。環境疫学の例を使用して、このトピックを見ていきます。
例: ラドン汚染 (Gelman and Hill 2006)
ラドンは、土壌から家に入る放射性ガスで、非喫煙者の肺がんの主な原因となる発がん性物質です。ラドンレベルは家屋ごとに大きく異なります。
EPA は、80,000 戸の家屋のラドンレベルの調査を行いました。2 つの重要な予測因子は次のとおりです。1. 地下室または 1 階での測定 (ラドンは地下室でより高い) 2. 郡のウランレベル (ラドンレベルとの正の相関)
ここでは、ミネソタ州のラドンレベルのモデリングに焦点を当てます。この例の階層は、各郡内の家屋です。
3 データマンジング
このセクションでは、radon データセットを取得し、最小限の前処理を行います。
def load_and_preprocess_radon_dataset(state='MN'):
  """Preprocess Radon dataset as done in "Bayesian Data Analysis" book.

  We filter to Minnesota data (919 examples) and preprocess to obtain the
  following features:
  - `log_uranium_ppm`: Log of soil uranium measurements.
  - `county`: Name of county in which the measurement was taken.
  - `floor`: Floor of house (0 for basement, 1 for first floor) on which the
    measurement was taken.

  The target variable is `log_radon`, the log of the Radon measurement in the
  house.
  """
  ds = tfds.load('radon', split='train')
  radon_data = tfds.as_dataframe(ds)
  radon_data.rename(lambda s: s[9:] if s.startswith('feat') else s, axis=1, inplace=True)
  df = radon_data[radon_data.state==state.encode()].copy()

  # For any missing or invalid activity readings, we'll use a value of `0.1`.
  df['radon'] = df.activity.apply(lambda x: x if x > 0. else 0.1)
  # Make county names look nice.
  df['county'] = df.county.apply(lambda s: s.decode()).str.strip().str.title()
  # Remap categories to start from 0 and end at max(category).
  county_name = sorted(df.county.unique())
  df['county'] = df.county.astype(
      pd.api.types.CategoricalDtype(categories=county_name)).cat.codes
  county_name = list(map(str.strip, county_name))

  df['log_radon'] = df['radon'].apply(np.log)
  df['log_uranium_ppm'] = df['Uppm'].apply(np.log)
  df = df[['idnum', 'log_radon', 'floor', 'county', 'log_uranium_ppm']]

  return df, county_name
radon, county_name = load_and_preprocess_radon_dataset()
num_counties = len(county_name)
num_observations = len(radon)
# Create copies of variables as Tensors.
county = tf.convert_to_tensor(radon['county'], dtype=tf.int32)
floor = tf.convert_to_tensor(radon['floor'], dtype=tf.float32)
log_radon = tf.convert_to_tensor(radon['log_radon'], dtype=tf.float32)
log_uranium = tf.convert_to_tensor(radon['log_uranium_ppm'], dtype=tf.float32)
radon.head()
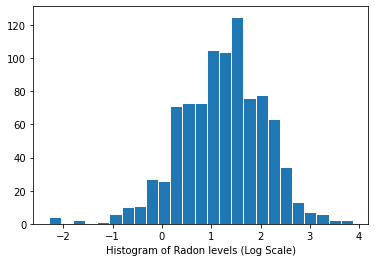
ラドンレベルの分布 (対数スケール):
plt.hist(log_radon.numpy(), bins=25, edgecolor='white')
plt.xlabel("Histogram of Radon levels (Log Scale)")
plt.show()
4 従来のアプローチ
ラドン曝露をモデル化するための 2 つの従来のアプローチは、偏りと分散のトレードオフの 2 つの極端な例を表しています。
完全なプーリング:
すべての郡を同じように扱い、単一のラドンレベルを推定します。\(y_i = \alpha + \beta x_i + \epsilon_i\)
プーリングなし:
各郡のラドンを個別にモデル化します。
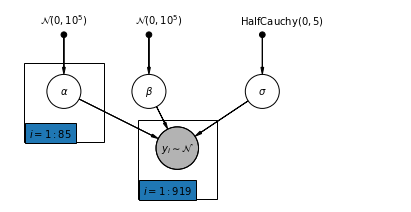
\(y_i = \alpha_{j[i]} + \beta x_i + \epsilon_i\) where \(j = 1,\ldots,85\)
エラー \(\epsilon_i\) は、測定エラー、一時的な家屋内の変動、または家屋の間の変動を表します。
4.1 Complete Pooling Model
pgm = daft.PGM([7, 3.5], node_unit=1.2)
pgm.add_node(
    daft.Node(
        "alpha_prior",
        r"$\mathcal{N}(0, 10^5)$",
        1,
        3,
        fixed=True,
        offset=(0, 5)))
pgm.add_node(
    daft.Node(
        "beta_prior",
        r"$\mathcal{N}(0, 10^5)$",
        2.5,
        3,
        fixed=True,
        offset=(10, 5)))
pgm.add_node(
    daft.Node(
        "sigma_prior",
        r"$\mathrm{HalfCauchy}(0, 5)$",
        4.5,
        3,
        fixed=True,
        offset=(20, 5)))
pgm.add_node(daft.Node("alpha", r"$\alpha$", 1, 2))
pgm.add_node(daft.Node("beta", r"$\beta$", 2.5, 2))
pgm.add_node(daft.Node("sigma", r"$\sigma$", 4.5, 2))
pgm.add_node(
    daft.Node(
        "y_i", r"$y_i \sim \mathcal{N}$", 3, 1, scale=1.25, observed=True))
pgm.add_edge("alpha_prior", "alpha")
pgm.add_edge("beta_prior", "beta")
pgm.add_edge("sigma_prior", "sigma")
pgm.add_edge("sigma", "y_i")
pgm.add_edge("alpha", "y_i")
pgm.add_edge("beta", "y_i")
pgm.add_plate(daft.Plate([2.3, 0.1, 1.4, 1.4], "$i = 1:919$"))

pgm.render()
plt.show()
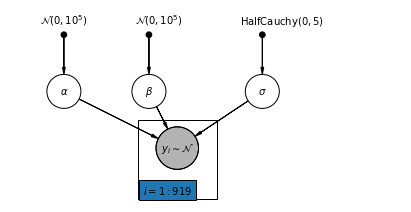
以下では、ハミルトニアンモンテカルロを使用して完全なプーリングモデルを適合させます。
@tf.function
def affine(x, kernel_diag, bias=tf.zeros([])):
  """`kernel_diag * x + bias` with broadcasting."""
  kernel_diag = tf.ones_like(x) * kernel_diag
  bias = tf.ones_like(x) * bias
  return x * kernel_diag + bias
def pooled_model(floor):
  """Creates a joint distribution representing our generative process."""
  return tfd.JointDistributionSequential([
      tfd.Normal(loc=0., scale=1e5),  # alpha
      tfd.Normal(loc=0., scale=1e5),  # beta
      tfd.HalfCauchy(loc=0., scale=5),  # sigma
      lambda s, b1, b0: tfd.MultivariateNormalDiag(  # y
          loc=affine(floor, b1[..., tf.newaxis], b0[..., tf.newaxis]),
          scale_identity_multiplier=s)
  ])


@tf.function
def pooled_log_prob(alpha, beta, sigma):
  """Computes `joint_log_prob` pinned at `log_radon`."""
  return pooled_model(floor).log_prob([alpha, beta, sigma, log_radon])
@tf.function
def sample_pooled(num_chains, num_results, num_burnin_steps, num_observations):
  """Samples from the pooled model."""
  hmc = tfp.mcmc.HamiltonianMonteCarlo(
      target_log_prob_fn=pooled_log_prob,
      num_leapfrog_steps=10,
      step_size=0.005)

  initial_state = [
      tf.zeros([num_chains], name='init_alpha'),
      tf.zeros([num_chains], name='init_beta'),
      tf.ones([num_chains], name='init_sigma')
  ]

  # Constrain `sigma` to the positive real axis. Other variables are
  # unconstrained.
  unconstraining_bijectors = [
      tfb.Identity(),  # alpha
      tfb.Identity(),  # beta
      tfb.Exp()        # sigma
  ]
  kernel = tfp.mcmc.TransformedTransitionKernel(
      inner_kernel=hmc, bijector=unconstraining_bijectors)

  samples, kernel_results = tfp.mcmc.sample_chain(
      num_results=num_results,
      num_burnin_steps=num_burnin_steps,
      current_state=initial_state,
      kernel=kernel)

  acceptance_probs = tf.reduce_mean(
      tf.cast(kernel_results.inner_results.is_accepted, tf.float32), axis=0)

  return samples, acceptance_probs
PooledModel = collections.namedtuple('PooledModel', ['alpha', 'beta', 'sigma'])

samples, acceptance_probs = sample_pooled(
    num_chains=4,
    num_results=1000,
    num_burnin_steps=1000,
    num_observations=num_observations)

print('Acceptance Probabilities for each chain: ', acceptance_probs.numpy())
pooled_samples = PooledModel._make(samples)
Acceptance Probabilities for each chain: [0.999 0.996 0.995 0.995]
for var, var_samples in pooled_samples._asdict().items():
  print('R-hat for ', var, ':\t',
        tfp.mcmc.potential_scale_reduction(var_samples).numpy())
R-hat for  alpha :     1.0019042
R-hat for  beta :  1.0135655
R-hat for  sigma :     0.99958754
def reduce_samples(var_samples, reduce_fn):
  """Reduces across leading two dims using reduce_fn."""
  # Collapse the first two dimensions, typically (num_chains, num_samples), and
  # compute np.mean or np.std along the remaining axis.
  if isinstance(var_samples, tf.Tensor):
    var_samples = var_samples.numpy() # convert to numpy array
  var_samples = np.reshape(var_samples, (-1,) +  var_samples.shape[2:])
  return np.apply_along_axis(reduce_fn, axis=0, arr=var_samples)

sample_mean = lambda samples : reduce_samples(samples, np.mean)
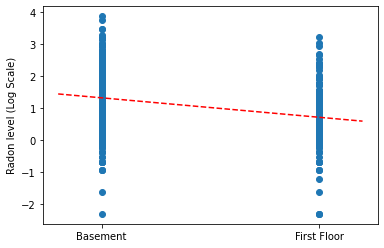
完全なプーリングモデルの勾配と切片の点推定をプロットします。
LinearEstimates = collections.namedtuple('LinearEstimates',
                                        ['intercept', 'slope'])

pooled_estimate = LinearEstimates(
  intercept=sample_mean(pooled_samples.alpha),
  slope=sample_mean(pooled_samples.beta)
)

plt.scatter(radon.floor, radon.log_radon)
xvals = np.linspace(-0.2, 1.2)
plt.ylabel('Radon level (Log Scale)')
plt.xticks([0, 1], ['Basement', 'First Floor'])
plt.plot(xvals, pooled_estimate.intercept + pooled_estimate.slope * xvals, 'r--')
plt.show()
Utility function to plot traces of sampled variables.
def plot_traces(var_name, samples, num_chains):
  if isinstance(samples, tf.Tensor):
    samples = samples.numpy() # convert to numpy array
  fig, axes = plt.subplots(1, 2, figsize=(14, 1.5), sharex='col', sharey='col')
  for chain in range(num_chains):
    axes[0].plot(samples[:, chain], alpha=0.7)
    axes[0].title.set_text("'{}' trace".format(var_name))
    sns.kdeplot(samples[:, chain], ax=axes[1], shade=False)
    axes[1].title.set_text("'{}' distribution".format(var_name))
    axes[0].set_xlabel('Iteration')
    axes[1].set_xlabel(var_name)
  plt.show()
for var, var_samples in pooled_samples._asdict().items():
  plot_traces(var, samples=var_samples, num_chains=4)


次に、プールされていないモデルの各郡のラドンレベルを推定します。
4.2 Unpooled Model
pgm = daft.PGM([7, 3.5], node_unit=1.2)
pgm.add_node(
    daft.Node(
        "alpha_prior",
        r"$\mathcal{N}(0, 10^5)$",
        1,
        3,
        fixed=True,
        offset=(0, 5)))
pgm.add_node(
    daft.Node(
        "beta_prior",
        r"$\mathcal{N}(0, 10^5)$",
        2.5,
        3,
        fixed=True,
        offset=(10, 5)))
pgm.add_node(
    daft.Node(
        "sigma_prior",
        r"$\mathrm{HalfCauchy}(0, 5)$",
        4.5,
        3,
        fixed=True,
        offset=(20, 5)))
pgm.add_node(daft.Node("alpha", r"$\alpha$", 1, 2))
pgm.add_node(daft.Node("beta", r"$\beta$", 2.5, 2))
pgm.add_node(daft.Node("sigma", r"$\sigma$", 4.5, 2))
pgm.add_node(
    daft.Node(
        "y_i", r"$y_i \sim \mathcal{N}$", 3, 1, scale=1.25, observed=True))
pgm.add_edge("alpha_prior", "alpha")
pgm.add_edge("beta_prior", "beta")
pgm.add_edge("sigma_prior", "sigma")
pgm.add_edge("sigma", "y_i")
pgm.add_edge("alpha", "y_i")
pgm.add_edge("beta", "y_i")
pgm.add_plate(daft.Plate([0.3, 1.1, 1.4, 1.4], "$i = 1:85$"))
pgm.add_plate(daft.Plate([2.3, 0.1, 1.4, 1.4], "$i = 1:919$"))

pgm.render()
plt.show()
def unpooled_model(floor, county):
  """Creates a joint distribution for the unpooled model."""
  return tfd.JointDistributionSequential([
      tfd.MultivariateNormalDiag(       # alpha
          loc=tf.zeros([num_counties]), scale_identity_multiplier=1e5),
      tfd.Normal(loc=0., scale=1e5),    # beta
      tfd.HalfCauchy(loc=0., scale=5),  # sigma
      lambda s, b1, b0: tfd.MultivariateNormalDiag(  # y
          loc=affine(
            floor, b1[..., tf.newaxis], tf.gather(b0, county, axis=-1)),
          scale_identity_multiplier=s)
  ])


@tf.function
def unpooled_log_prob(beta0, beta1, sigma):
  """Computes `joint_log_prob` pinned at `log_radon`."""
  return (
    unpooled_model(floor, county).log_prob([beta0, beta1, sigma, log_radon]))
@tf.function
def sample_unpooled(num_chains, num_results, num_burnin_steps):
  """Samples from the unpooled model."""
  # Initialize the HMC transition kernel.
  hmc = tfp.mcmc.HamiltonianMonteCarlo(
      target_log_prob_fn=unpooled_log_prob,
      num_leapfrog_steps=10,
      step_size=0.025)

  initial_state = [
      tf.zeros([num_chains, num_counties], name='init_beta0'),
      tf.zeros([num_chains], name='init_beta1'),
      tf.ones([num_chains], name='init_sigma')
  ]
  # Contrain `sigma` to the positive real axis. Other variables are
  # unconstrained.
  unconstraining_bijectors = [
      tfb.Identity(),  # alpha
      tfb.Identity(),  # beta
      tfb.Exp()        # sigma
  ]
  kernel = tfp.mcmc.TransformedTransitionKernel(
      inner_kernel=hmc, bijector=unconstraining_bijectors)
  samples, kernel_results = tfp.mcmc.sample_chain(
      num_results=num_results,
      num_burnin_steps=num_burnin_steps,
      current_state=initial_state,
      kernel=kernel)

  acceptance_probs = tf.reduce_mean(
      tf.cast(kernel_results.inner_results.is_accepted, tf.float32), axis=0)

  return samples, acceptance_probs
UnpooledModel = collections.namedtuple('UnpooledModel',
                                       ['alpha', 'beta', 'sigma'])

samples, acceptance_probs = sample_unpooled(
    num_chains=4, num_results=1000, num_burnin_steps=1000)

print('Acceptance Probabilities: ', acceptance_probs.numpy())
unpooled_samples = UnpooledModel._make(samples)

print('R-hat for beta:',
      tfp.mcmc.potential_scale_reduction(unpooled_samples.beta).numpy())
print('R-hat for sigma:',
      tfp.mcmc.potential_scale_reduction(unpooled_samples.sigma).numpy())
Acceptance Probabilities:  [0.895 0.897 0.893 0.901]
R-hat for beta: 1.0052257
R-hat for sigma: 1.0035229
plot_traces(var_name='beta', samples=unpooled_samples.beta, num_chains=4)
plot_traces(var_name='sigma', samples=unpooled_samples.sigma, num_chains=4)


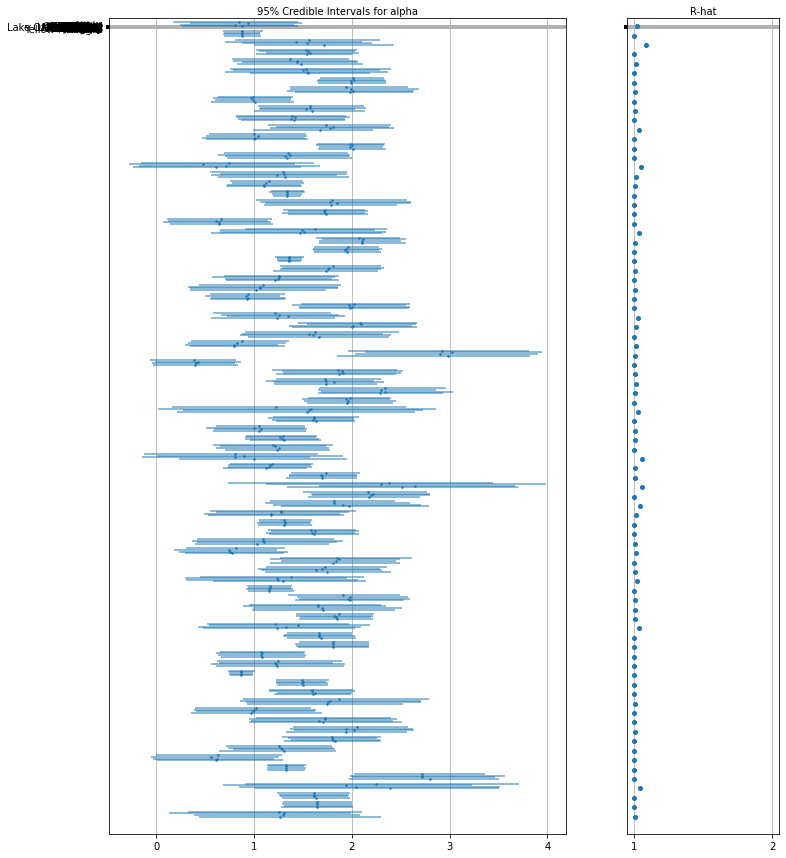
これは、切片のプールされていない郡の期待値と、各チェーンの 95% の信頼区間です。また、各郡の推定 R-hat 値も報告します。
Utility function for Forest plots.
def forest_plot(num_chains, num_vars, var_name, var_labels, samples):
  fig, axes = plt.subplots(
      1, 2, figsize=(12, 15), sharey=True, gridspec_kw={'width_ratios': [3, 1]})
  for var_idx in range(num_vars):
    values = samples[..., var_idx]
    rhat = tfp.mcmc.diagnostic.potential_scale_reduction(values).numpy()
    meds = np.median(values, axis=-2)
    los = np.percentile(values, 5, axis=-2)
    his = np.percentile(values, 95, axis=-2)

    for i in range(num_chains):
      height = 0.1 + 0.3 * var_idx + 0.05 * i
      axes[0].plot([los[i], his[i]], [height, height], 'C0-', lw=2, alpha=0.5)
      axes[0].plot([meds[i]], [height], 'C0o', ms=1.5)
    axes[1].plot([rhat], [height], 'C0o', ms=4)

  axes[0].set_yticks(np.linspace(0.2, 0.3, num_vars))
  axes[0].set_ylim(0, 26)
  axes[0].grid(which='both')
  axes[0].invert_yaxis()
  axes[0].set_yticklabels(var_labels)
  axes[0].xaxis.set_label_position('top')
  axes[0].set(xlabel='95% Credible Intervals for {}'.format(var_name))

  axes[1].set_xticks([1, 2])
  axes[1].set_xlim(0.95, 2.05)
  axes[1].grid(which='both')
  axes[1].set(xlabel='R-hat')
  axes[1].xaxis.set_label_position('top')

  plt.show()
forest_plot(
    num_chains=4,
    num_vars=num_counties,
    var_name='alpha',
    var_labels=county_name,
    samples=unpooled_samples.alpha.numpy())
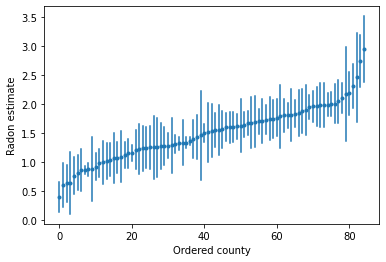
順序付けられた推定値をプロットして、ラドンレベルが高い郡を特定します。
unpooled_intercepts = reduce_samples(unpooled_samples.alpha, np.mean)
unpooled_intercepts_se = reduce_samples(unpooled_samples.alpha, np.std)

def plot_ordered_estimates():
  means = pd.Series(unpooled_intercepts, index=county_name)
  std_errors = pd.Series(unpooled_intercepts_se, index=county_name)
  order = means.sort_values().index

  plt.plot(range(num_counties), means[order], '.')
  for i, m, se in zip(range(num_counties), means[order], std_errors[order]):
    plt.plot([i, i], [m - se, m + se], 'C0-')
  plt.xlabel('Ordered county')
  plt.ylabel('Radon estimate')
  plt.show()

plot_ordered_estimates()
Utility function to plot estimates for a sample set of counties.
def plot_estimates(linear_estimates, labels, sample_counties):
  fig, axes = plt.subplots(2, 4, figsize=(12, 6), sharey=True, sharex=True)
  axes = axes.ravel()
  intercepts_indexed = []
  slopes_indexed = []
  for intercepts, slopes in linear_estimates:
    intercepts_indexed.append(pd.Series(intercepts, index=county_name))
    slopes_indexed.append(pd.Series(slopes, index=county_name))

  markers = ['-', 'r--', 'k:']
  sample_county_codes = [county_name.index(c) for c in sample_counties]
  for i, c in enumerate(sample_county_codes):
    y = radon.log_radon[radon.county == c]
    x = radon.floor[radon.county == c]
    axes[i].scatter(
        x + np.random.randn(len(x)) * 0.01, y, alpha=0.4, label='Log Radon')

    # Plot both models and data
    xvals = np.linspace(-0.2, 1.2)
    for k in range(len(intercepts_indexed)):
      axes[i].plot(
          xvals,
          intercepts_indexed[k][c] + slopes_indexed[k][c] * xvals,
          markers[k],
          label=labels[k])

    axes[i].set_xticks([0, 1])
    axes[i].set_xticklabels(['Basement', 'First Floor'])
    axes[i].set_ylim(-1, 3)
    axes[i].set_title(sample_counties[i])
    if not i % 2:
      axes[i].set_ylabel('Log Radon level')
  axes[3].legend(bbox_to_anchor=(1.05, 0.9), borderaxespad=0.)

  plt.show()
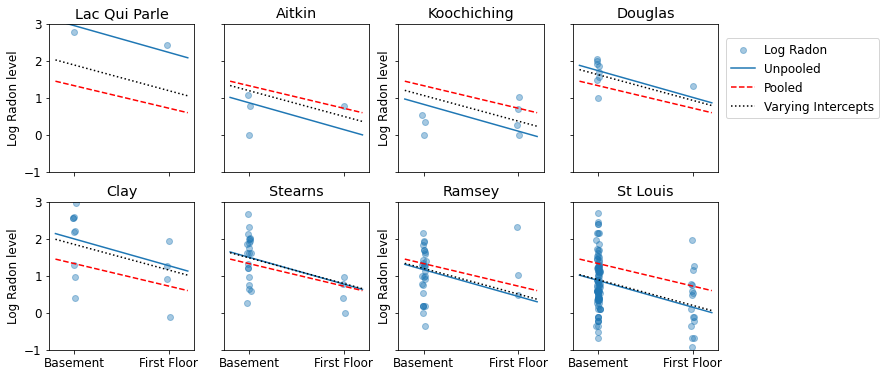
これは、サンプルサイズの範囲を表す郡のサブセットのプールされた推定値とプールされていない推定値の視覚的な比較です。
unpooled_estimates = LinearEstimates(
  sample_mean(unpooled_samples.alpha),
  sample_mean(unpooled_samples.beta)
)

sample_counties = ('Lac Qui Parle', 'Aitkin', 'Koochiching', 'Douglas', 'Clay',
                   'Stearns', 'Ramsey', 'St Louis')
plot_estimates(
    linear_estimates=[unpooled_estimates, pooled_estimate],
    labels=['Unpooled Estimates', 'Pooled Estimates'],
    sample_counties=sample_counties)
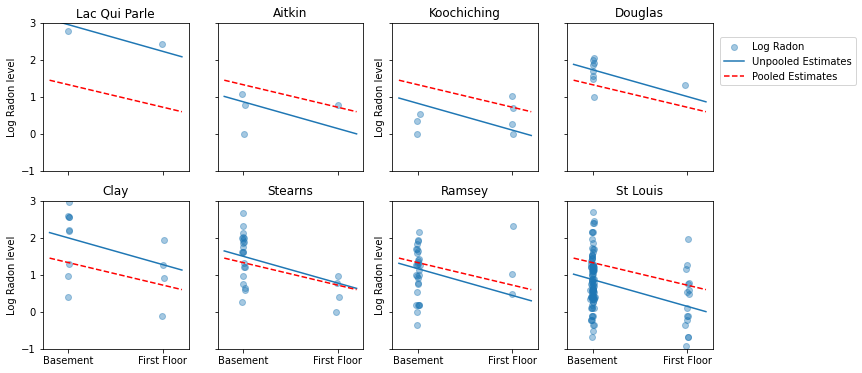
これらのモデルはどちらも不十分です。
- ラドンの測定値が高い郡を特定する場合、プーリングは役に立ちません。
- 少ない観測値を使用するモデルによって生成された極端なプールされていない推定値は信頼できません。
5 マルチレベルモデルと階層モデル
データをプールすると、さまざまなデータポイントがさまざまな郡からのものであるという情報が失われます。これは、各 radon レベルの観測値が同じ確率分布からサンプリングされることを意味します。このようなモデルは、グループ (郡など) 固有のサンプリングユニットのバリエーションを学習できません。サンプリング分散のみを考慮します。
mpl.rc("font", size=18)

pgm = daft.PGM([13.6, 2.2], origin=[1.15, 1.0], node_ec="none")
pgm.add_node(daft.Node("parameter", r"parameter", 2.0, 3))
pgm.add_node(daft.Node("observations", r"observations", 2.0, 2))
pgm.add_node(daft.Node("theta", r"$\theta$", 5.5, 3))
pgm.add_node(daft.Node("y_0", r"$y_0$", 4, 2))
pgm.add_node(daft.Node("y_1", r"$y_1$", 5, 2))
pgm.add_node(daft.Node("dots", r"$\cdots$", 6, 2))
pgm.add_node(daft.Node("y_k", r"$y_k$", 7, 2))
pgm.add_edge("theta", "y_0")
pgm.add_edge("theta", "y_1")
pgm.add_edge("theta", "y_k")
pgm.render()
plt.show()

プールされていないデータを分析する場合、それらは別々のモデルから独立してサンプリングされていることを意味します。プールされた場合とは反対に、極端な場合、このアプローチではサンプリング単位間の差が大きすぎてそれらを組み合わせることができません。
mpl.rc("font", size=18)

pgm = daft.PGM([13.6, 2.2], origin=[1.15, 1.0], node_ec="none")
pgm.add_node(daft.Node("parameter", r"parameter", 2.0, 3))
pgm.add_node(daft.Node("observations", r"observations", 2.0, 2))
pgm.add_node(daft.Node("theta_0", r"$\theta_0$", 4, 3))
pgm.add_node(daft.Node("theta_1", r"$\theta_1$", 5, 3))
pgm.add_node(daft.Node("theta_dots", r"$\cdots$", 6, 3))
pgm.add_node(daft.Node("theta_k", r"$\theta_k$", 7, 3))

pgm.add_node(daft.Node("y_0", r"$y_0$", 4, 2))
pgm.add_node(daft.Node("y_1", r"$y_1$", 5, 2))
pgm.add_node(daft.Node("y_dots", r"$\cdots$", 6, 2))
pgm.add_node(daft.Node("y_k", r"$y_k$", 7, 2))
pgm.add_edge("theta_0", "y_0")
pgm.add_edge("theta_1", "y_1")
pgm.add_edge("theta_k", "y_k")
pgm.render()
plt.show()

階層モデルでは、パラメータはパラメータの母集団分布からのサンプルとして表示されます。したがって、それらは完全に異なるものでも、まったく同じものでもないと見なされます。これは、部分プーリングとして知られています。
mpl.rc("font", size=18)

pgm = daft.PGM([13.6, 3.4], origin=[1.15, 1.0], node_ec="none")
pgm.add_node(daft.Node("model", r"model", 2.0, 4))
pgm.add_node(daft.Node("parameter", r"parameter", 2.0, 3))
pgm.add_node(daft.Node("observations", r"observations", 2.0, 2))
pgm.add_node(daft.Node("mu_sigma", r"$\mu,\sigma^2$", 5.5, 4))
pgm.add_node(daft.Node("theta_0", r"$\theta_0$", 4, 3))
pgm.add_node(daft.Node("theta_1", r"$\theta_1$", 5, 3))
pgm.add_node(daft.Node("theta_dots", r"$\cdots$", 6, 3))
pgm.add_node(daft.Node("theta_k", r"$\theta_k$", 7, 3))
pgm.add_node(daft.Node("y_0", r"$y_0$", 4, 2))
pgm.add_node(daft.Node("y_1", r"$y_1$", 5, 2))
pgm.add_node(daft.Node("y_dots", r"$\cdots$", 6, 2))
pgm.add_node(daft.Node("y_k", r"$y_k$", 7, 2))
pgm.add_edge("mu_sigma", "theta_0")
pgm.add_edge("mu_sigma", "theta_1")
pgm.add_edge("mu_sigma", "theta_k")
pgm.add_edge("theta_0", "y_0")
pgm.add_edge("theta_1", "y_1")
pgm.add_edge("theta_k", "y_k")
pgm.render()
plt.show()

5.1 部分プーリング
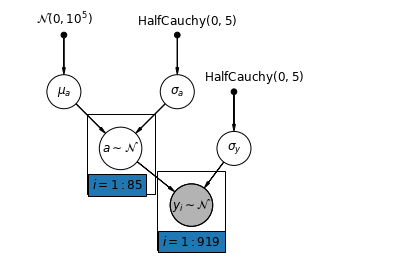
家屋のラドンデータセットの最も単純な部分プーリングモデルは、グループレベルまたは個々レベルのいずれにも予測子を使用せずに、ラドンレベルを単純に推定するモデルです。個々レベルの予測子の例は、データポイントが地下室からのものか 1 階からのものかです。グループレベルの予測因子は、郡全体の平均ウランレベルなどです。
部分プーリングモデルは、プールされた極値とプールされていない極値の間の妥協点を表します。これは、プールされていない郡の推定値とプールされた推定値のほぼ加重平均 (サンプルサイズに基づく) です。
\(\hat{\alpha}*j\) を郡 \(j\) の推定対数ラドンレベルとします。これは単なる切片です。ここでは勾配は無視します。\(n_j\) は、郡 \(j\) からの観測値の数です。\(\sigma*{\alpha}\) と \(\sigma_y\) は、それぞれパラメータ内の分散とサンプリング分散です。部分的なプーリングモデルは次のことを想定できます。
\[\hat{\alpha}_j \approx \frac{(n_j/\sigma_y^2)\bar{y}_j + (1/\sigma_{\alpha}^2)\bar{y} }{(n_j/\sigma_y^2) + (1/\sigma_{\alpha}^2)}\]
部分プーリングを使用する場合、次のことが期待されます。
- サンプルサイズが小さい郡の推定値は、州全体の平均に向かって縮小します。
- サンプルサイズが大きい郡の推定値は、プールされていない郡の推定値に近くなります。
mpl.rc("font", size=12)
pgm = daft.PGM([7, 4.5], node_unit=1.2)
pgm.add_node(
    daft.Node(
        "mu_a_prior",
        r"$\mathcal{N}(0, 10^5)$",
        1,
        4,
        fixed=True,
        offset=(0, 5)))
pgm.add_node(
    daft.Node(
        "sigma_a_prior",
        r"$\mathrm{HalfCauchy}(0, 5)$",
        3,
        4,
        fixed=True,
        offset=(10, 5)))
pgm.add_node(
    daft.Node(
        "sigma_prior",
        r"$\mathrm{HalfCauchy}(0, 5)$",
        4,
        3,
        fixed=True,
        offset=(20, 5)))
pgm.add_node(daft.Node("mu_a", r"$\mu_a$", 1, 3))
pgm.add_node(daft.Node("sigma_a", r"$\sigma_a$", 3, 3))
pgm.add_node(daft.Node("a", r"$a \sim \mathcal{N}$", 2, 2, scale=1.25))
pgm.add_node(daft.Node("sigma_y", r"$\sigma_y$", 4, 2))
pgm.add_node(
    daft.Node(
        "y_i", r"$y_i \sim \mathcal{N}$", 3.25, 1, scale=1.25, observed=True))
pgm.add_edge("mu_a_prior", "mu_a")
pgm.add_edge("sigma_a_prior", "sigma_a")
pgm.add_edge("mu_a", "a")
pgm.add_edge("sigma_a", "a")
pgm.add_edge("sigma_prior", "sigma_y")
pgm.add_edge("sigma_y", "y_i")
pgm.add_edge("a", "y_i")
pgm.add_plate(daft.Plate([1.4, 1.2, 1.2, 1.4], "$i = 1:85$"))
pgm.add_plate(daft.Plate([2.65, 0.2, 1.2, 1.4], "$i = 1:919$"))

pgm.render()
plt.show()
def partial_pooling_model(county):
  """Creates a joint distribution for the partial pooling model."""
  return tfd.JointDistributionSequential([
      tfd.Normal(loc=0., scale=1e5),    # mu_a
      tfd.HalfCauchy(loc=0., scale=5),  # sigma_a
      lambda sigma_a, mu_a: tfd.MultivariateNormalDiag(  # a
          loc=mu_a[..., tf.newaxis] * tf.ones([num_counties])[tf.newaxis, ...],
          scale_identity_multiplier=sigma_a),
      tfd.HalfCauchy(loc=0., scale=5),  # sigma_y
      lambda sigma_y, a: tfd.MultivariateNormalDiag(  # y
          loc=tf.gather(a, county, axis=-1),
          scale_identity_multiplier=sigma_y)
  ])


@tf.function
def partial_pooling_log_prob(mu_a, sigma_a, a, sigma_y):
  """Computes joint log prob pinned at `log_radon`."""
  return partial_pooling_model(county).log_prob(
      [mu_a, sigma_a, a, sigma_y, log_radon])
@tf.function
def sample_partial_pooling(num_chains, num_results, num_burnin_steps):
  """Samples from the partial pooling model."""
  hmc = tfp.mcmc.HamiltonianMonteCarlo(
      target_log_prob_fn=partial_pooling_log_prob,
      num_leapfrog_steps=10,
      step_size=0.01)

  initial_state = [
      tf.zeros([num_chains], name='init_mu_a'),
      tf.ones([num_chains], name='init_sigma_a'),
      tf.zeros([num_chains, num_counties], name='init_a'),
      tf.ones([num_chains], name='init_sigma_y')
  ]
  unconstraining_bijectors = [
      tfb.Identity(),  # mu_a
      tfb.Exp(),       # sigma_a
      tfb.Identity(),  # a
      tfb.Exp()        # sigma_y
  ]
  kernel = tfp.mcmc.TransformedTransitionKernel(
      inner_kernel=hmc, bijector=unconstraining_bijectors)
  samples, kernel_results = tfp.mcmc.sample_chain(
      num_results=num_results,
      num_burnin_steps=num_burnin_steps,
      current_state=initial_state,
      kernel=kernel)

  acceptance_probs = tf.reduce_mean(
      tf.cast(kernel_results.inner_results.is_accepted, tf.float32), axis=0)

  return samples, acceptance_probs
PartialPoolingModel = collections.namedtuple(
    'PartialPoolingModel', ['mu_a', 'sigma_a', 'a', 'sigma_y'])

samples, acceptance_probs = sample_partial_pooling(
    num_chains=4, num_results=1000, num_burnin_steps=1000)

print('Acceptance Probabilities: ', acceptance_probs.numpy())
partial_pooling_samples = PartialPoolingModel._make(samples)
Acceptance Probabilities: [0.989 0.978 0.987 0.987]
for var in ['mu_a', 'sigma_a', 'sigma_y']:
  print(
      'R-hat for ', var, '\t:',
      tfp.mcmc.potential_scale_reduction(getattr(partial_pooling_samples,
                                                 var)).numpy())
R-hat for  mu_a     : 1.0276643
R-hat for  sigma_a  : 1.0204039
R-hat for  sigma_y  : 1.0008202
partial_pooling_intercepts = reduce_samples(
    partial_pooling_samples.a.numpy(), np.mean)
partial_pooling_intercepts_se = reduce_samples(
    partial_pooling_samples.a.numpy(), np.std)

def plot_unpooled_vs_partial_pooling_estimates():
  fig, axes = plt.subplots(1, 2, figsize=(14, 6), sharex=True, sharey=True)

  # Order counties by number of observations (and add some jitter).
  num_obs_per_county = (
      radon.groupby('county')['idnum'].count().values.astype(np.float32))
  num_obs_per_county += np.random.normal(scale=0.5, size=num_counties)

  intercepts_list = [unpooled_intercepts, partial_pooling_intercepts]
  intercepts_se_list = [unpooled_intercepts_se, partial_pooling_intercepts_se]

  for ax, means, std_errors in zip(axes, intercepts_list, intercepts_se_list):
    ax.plot(num_obs_per_county, means, 'C0.')
    for n, m, se in zip(num_obs_per_county, means, std_errors):
      ax.plot([n, n], [m - se, m + se], 'C1-', alpha=.5)

  for ax in axes:
    ax.set_xscale('log')
    ax.set_xlabel('No. of Observations Per County')
    ax.set_xlim(1, 100)
    ax.set_ylabel('Log Radon Estimate (with Standard Error)')
    ax.set_ylim(0, 3)
    ax.hlines(partial_pooling_intercepts.mean(), .9, 125, 'k', '--', alpha=.5)
  axes[0].set_title('Unpooled Estimates')
  axes[1].set_title('Partially Pooled Estimates')

plot_unpooled_vs_partial_pooling_estimates()
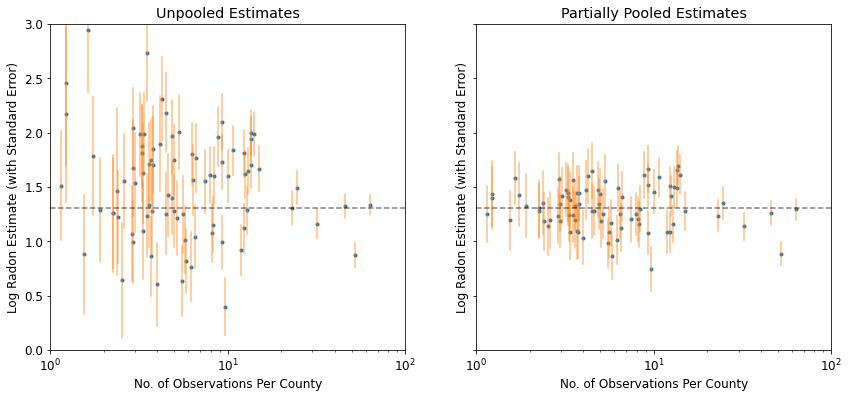
特にサンプルサイズが小さい場合、プールされていない推定値と部分的にプールされた推定値の違いに注意してください。前者は、より極端で不正確です。
5.2 切片の変動
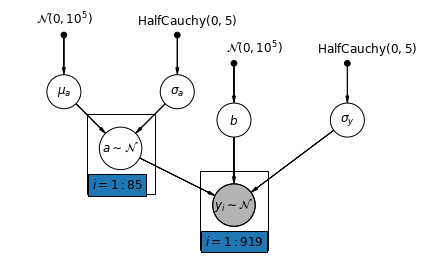
次に、変量効果に従って切片を郡全体で変化させることができる、より複雑なモデルを検討します。
\(y_i = \alpha_{j[i]} + \beta x_{i} + \epsilon_i\) where \(\epsilon_i \sim N(0, \sigma_y^2)\) and the intercept random effect: \(\alpha_{j[i]} \sim N(\mu_{\alpha}, \sigma_{\alpha}^2)\)
ここでも、測定場所 (地下室または 1 階) に応じて観測値を変化させる勾配 \(\beta\) は、異なる郡間で共有される固定効果です。
プーリングされていないモデルと同様に、郡ごとに個別の切片を設定しますが、郡ごとに個別の最小二乗回帰モデルを当てはめるのではなく、マルチレベルモデリングは郡間で強度を共有し、データが少ない場合、郡でのより合理的な推論を可能にします。
mpl.rc("font", size=12)
pgm = daft.PGM([7, 4.5], node_unit=1.2)
pgm.add_node(
    daft.Node(
        "mu_a_prior",
        r"$\mathcal{N}(0, 10^5)$",
        1,
        4,
        fixed=True,
        offset=(0, 5)))
pgm.add_node(
    daft.Node(
        "sigma_a_prior",
        r"$\mathrm{HalfCauchy}(0, 5)$",
        3,
        4,
        fixed=True,
        offset=(10, 5)))
pgm.add_node(
    daft.Node(
        "b_prior",
        r"$\mathcal{N}(0, 10^5)$",
        4,
        3.5,
        fixed=True,
        offset=(20, 5)))
pgm.add_node(daft.Node("b", r"$b$", 4, 2.5))
pgm.add_node(
    daft.Node(
        "sigma_prior",
        r"$\mathrm{HalfCauchy}(0, 5)$",
        6,
        3.5,
        fixed=True,
        offset=(20, 5)))
pgm.add_node(daft.Node("mu_a", r"$\mu_a$", 1, 3))
pgm.add_node(daft.Node("sigma_a", r"$\sigma_a$", 3, 3))
pgm.add_node(daft.Node("a", r"$a \sim \mathcal{N}$", 2, 2, scale=1.25))
pgm.add_node(daft.Node("sigma_y", r"$\sigma_y$", 6, 2.5))
pgm.add_node(
    daft.Node(
        "y_i", r"$y_i \sim \mathcal{N}$", 4, 1, scale=1.25, observed=True))
pgm.add_edge("mu_a_prior", "mu_a")
pgm.add_edge("sigma_a_prior", "sigma_a")
pgm.add_edge("mu_a", "a")
pgm.add_edge("b_prior", "b")
pgm.add_edge("sigma_a", "a")
pgm.add_edge("sigma_prior", "sigma_y")
pgm.add_edge("sigma_y", "y_i")
pgm.add_edge("a", "y_i")
pgm.add_edge("b", "y_i")
pgm.add_plate(daft.Plate([1.4, 1.2, 1.2, 1.4], "$i = 1:85$"))
pgm.add_plate(daft.Plate([3.4, 0.2, 1.2, 1.4], "$i = 1:919$"))

pgm.render()
plt.show()
def varying_intercept_model(floor, county):
  """Creates a joint distribution for the varying intercept model."""
  return tfd.JointDistributionSequential([
      tfd.Normal(loc=0., scale=1e5),    # mu_a
      tfd.HalfCauchy(loc=0., scale=5),  # sigma_a
      lambda sigma_a, mu_a: tfd.MultivariateNormalDiag(  # a
          loc=affine(tf.ones([num_counties]), mu_a[..., tf.newaxis]),
          scale_identity_multiplier=sigma_a),
      tfd.Normal(loc=0., scale=1e5),    # b
      tfd.HalfCauchy(loc=0., scale=5),  # sigma_y
      lambda sigma_y, b, a: tfd.MultivariateNormalDiag(  # y
          loc=affine(floor, b[..., tf.newaxis], tf.gather(a, county, axis=-1)),
          scale_identity_multiplier=sigma_y)
  ])


def varying_intercept_log_prob(mu_a, sigma_a, a, b, sigma_y):
  """Computes joint log prob pinned at `log_radon`."""
  return varying_intercept_model(floor, county).log_prob(
      [mu_a, sigma_a, a, b, sigma_y, log_radon])
@tf.function
def sample_varying_intercepts(num_chains, num_results, num_burnin_steps):
  """Samples from the varying intercepts model."""
  hmc = tfp.mcmc.HamiltonianMonteCarlo(
      target_log_prob_fn=varying_intercept_log_prob,
      num_leapfrog_steps=10,
      step_size=0.01)

  initial_state = [
      tf.zeros([num_chains], name='init_mu_a'),
      tf.ones([num_chains], name='init_sigma_a'),
      tf.zeros([num_chains, num_counties], name='init_a'),
      tf.zeros([num_chains], name='init_b'),
      tf.ones([num_chains], name='init_sigma_y')
  ]
  unconstraining_bijectors = [
      tfb.Identity(),  # mu_a
      tfb.Exp(),       # sigma_a
      tfb.Identity(),  # a
      tfb.Identity(),  # b
      tfb.Exp()        # sigma_y
  ]
  kernel = tfp.mcmc.TransformedTransitionKernel(
      inner_kernel=hmc, bijector=unconstraining_bijectors)
  samples, kernel_results = tfp.mcmc.sample_chain(
      num_results=num_results,
      num_burnin_steps=num_burnin_steps,
      current_state=initial_state,
      kernel=kernel)

  acceptance_probs = tf.reduce_mean(
      tf.cast(kernel_results.inner_results.is_accepted, tf.float32), axis=0)

  return samples, acceptance_probs
VaryingInterceptsModel = collections.namedtuple(
    'VaryingInterceptsModel', ['mu_a', 'sigma_a', 'a', 'b', 'sigma_y'])

samples, acceptance_probs = sample_varying_intercepts(
    num_chains=4, num_results=1000, num_burnin_steps=1000)

print('Acceptance Probabilities: ', acceptance_probs.numpy())
varying_intercepts_samples = VaryingInterceptsModel._make(samples)
Acceptance Probabilities: [0.989 0.98 0.988 0.983]
for var in ['mu_a', 'sigma_a', 'b', 'sigma_y']:
  print(
      'R-hat for ', var, ': ',
      tfp.mcmc.potential_scale_reduction(
          getattr(varying_intercepts_samples, var)).numpy())
R-hat for  mu_a :  1.0196627
R-hat for  sigma_a :  1.0671698
R-hat for  b :  1.0017126
R-hat for  sigma_y :  0.99950683
varying_intercepts_estimates = LinearEstimates(
    sample_mean(varying_intercepts_samples.a),
    sample_mean(varying_intercepts_samples.b))
sample_counties = ('Lac Qui Parle', 'Aitkin', 'Koochiching', 'Douglas', 'Clay',
                   'Stearns', 'Ramsey', 'St Louis')
plot_estimates(
    linear_estimates=[
        unpooled_estimates, pooled_estimate, varying_intercepts_estimates
    ],
    labels=['Unpooled', 'Pooled', 'Varying Intercepts'],
    sample_counties=sample_counties)
def plot_posterior(var_name, var_samples):
  if isinstance(var_samples, tf.Tensor):
    var_samples = var_samples.numpy() # convert to numpy array

  fig = plt.figure(figsize=(10, 3))
  ax = fig.add_subplot(111)
  ax.hist(var_samples.flatten(), bins=40, edgecolor='white')
  sample_mean = var_samples.mean()
  ax.text(
      sample_mean,
      100,
      'mean={:.3f}'.format(sample_mean),
      color='white',
      fontsize=12)
  ax.set_xlabel('posterior of ' + var_name)
  plt.show()


plot_posterior('b', varying_intercepts_samples.b)
plot_posterior('sigma_a', varying_intercepts_samples.sigma_a)
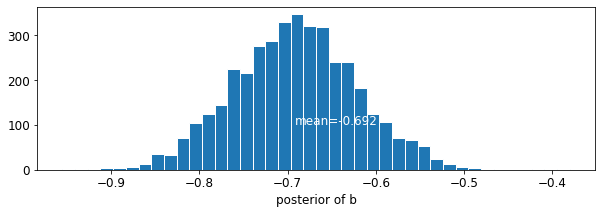
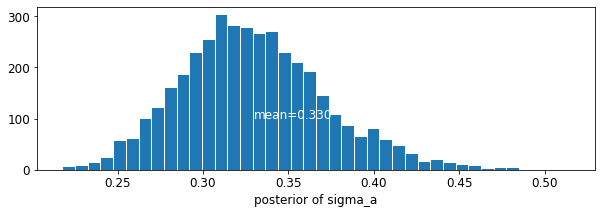
階の係数の推定値は約 -0.69 であり、郡を考慮した後、地下室のない家は地下室のある家のラドンレベルの約半分 (\(\exp(-0.69) = 0.50\)) であると解釈できます。
for var in ['b']:
  var_samples = getattr(varying_intercepts_samples, var)
  mean = var_samples.numpy().mean()
  std = var_samples.numpy().std()
  r_hat = tfp.mcmc.potential_scale_reduction(var_samples).numpy()
  n_eff = tfp.mcmc.effective_sample_size(var_samples).numpy().sum()

  print('var: ', var, ' mean: ', mean, ' std: ', std, ' n_eff: ', n_eff,
        ' r_hat: ', r_hat)
var: b mean: -0.6920927 std: 0.07004689 n_eff: 430.58865 r_hat: 1.0017126
def plot_intercepts_and_slopes(linear_estimates, title):
  xvals = np.arange(2)
  intercepts = np.ones([num_counties]) * linear_estimates.intercept
  slopes = np.ones([num_counties]) * linear_estimates.slope
  fig, ax = plt.subplots()
  for c in range(num_counties):
    ax.plot(xvals, intercepts[c] + slopes[c] * xvals, 'bo-', alpha=0.4)
  plt.xlim(-0.2, 1.2)
  ax.set_xticks([0, 1])
  ax.set_xticklabels(['Basement', 'First Floor'])
  ax.set_ylabel('Log Radon level')
  plt.title(title)
  plt.show()
plot_intercepts_and_slopes(varying_intercepts_estimates,
                           'Log Radon Estimates (Varying Intercepts)')
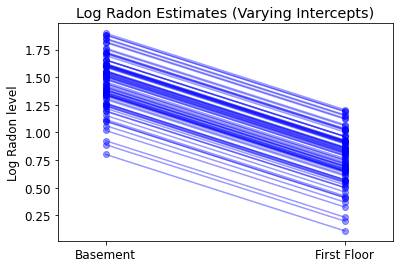
5.3 勾配の変動
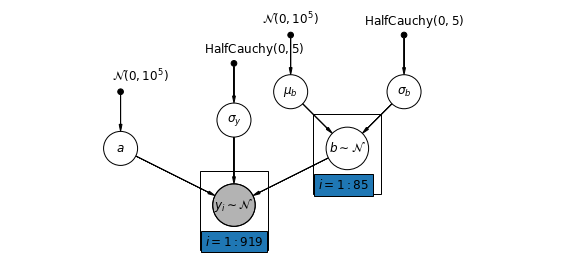
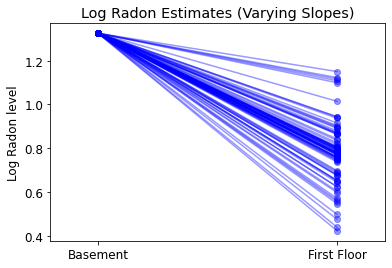
また、測定場所 (地下室または 1 階) がラドンの測定値にどのように影響するかによって郡が変化することを可能にするモデルを想定することもできます。この場合、切片 \(\alpha\) は郡間で共有されます。
$$y_i = \alpha + \beta_{j[i]} x_{i} + \epsilon_i$$
mpl.rc("font", size=12)
pgm = daft.PGM([10, 4.5], node_unit=1.2)
pgm.add_node(
    daft.Node(
        "mu_b_prior",
        r"$\mathcal{N}(0, 10^5)$",
        3.2,
        4,
        fixed=True,
        offset=(0, 5)))
pgm.add_node(
    daft.Node(
        "a_prior", r"$\mathcal{N}(0, 10^5)$", 2, 3, fixed=True, offset=(20, 5)))
pgm.add_node(daft.Node("a", r"$a$", 2, 2))

pgm.add_node(
    daft.Node(
        "sigma_prior",
        r"$\mathrm{HalfCauchy}(0, 5)$",
        4,
        3.5,
        fixed=True,
        offset=(20, 5)))
pgm.add_node(daft.Node("sigma_y", r"$\sigma_y$", 4, 2.5))

pgm.add_node(
    daft.Node(
        "mu_b_prior",
        r"$\mathcal{N}(0, 10^5)$",
        5,
        4,
        fixed=True,
        offset=(0, 5)))
pgm.add_node(
    daft.Node(
        "sigma_b_prior",
        r"$\mathrm{HalfCauchy}(0, 5)$",
        7,
        4,
        fixed=True,
        offset=(10, 5)))
pgm.add_node(daft.Node("mu_b", r"$\mu_b$", 5, 3))
pgm.add_node(daft.Node("sigma_b", r"$\sigma_b$", 7, 3))
pgm.add_node(daft.Node("b", r"$b \sim \mathcal{N}$", 6, 2, scale=1.25))

pgm.add_node(
    daft.Node(
        "y_i", r"$y_i \sim \mathcal{N}$", 4, 1, scale=1.25, observed=True))
pgm.add_edge("a_prior", "a")

pgm.add_edge("mu_b_prior", "mu_b")
pgm.add_edge("sigma_b_prior", "sigma_b")
pgm.add_edge("mu_b", "b")
pgm.add_edge("sigma_b", "b")

pgm.add_edge("sigma_prior", "sigma_y")

pgm.add_edge("sigma_y", "y_i")
pgm.add_edge("a", "y_i")
pgm.add_edge("b", "y_i")
pgm.add_plate(daft.Plate([5.4, 1.2, 1.2, 1.4], "$i = 1:85$"))
pgm.add_plate(daft.Plate([3.4, 0.2, 1.2, 1.4], "$i = 1:919$"))

pgm.render()
plt.show()
def varying_slopes_model(floor, county):
  """Creates a joint distribution for the varying slopes model."""
  return tfd.JointDistributionSequential([
      tfd.Normal(loc=0., scale=1e5),  # mu_b
      tfd.HalfCauchy(loc=0., scale=5),  # sigma_b
      tfd.Normal(loc=0., scale=1e5),  # a
      lambda _, sigma_b, mu_b: tfd.MultivariateNormalDiag(  # b
          loc=affine(tf.ones([num_counties]), mu_b[..., tf.newaxis]),
          scale_identity_multiplier=sigma_b),
      tfd.HalfCauchy(loc=0., scale=5),  # sigma_y
      lambda sigma_y, b, a: tfd.MultivariateNormalDiag(  # y
          loc=affine(floor, tf.gather(b, county, axis=-1), a[..., tf.newaxis]),
          scale_identity_multiplier=sigma_y)
  ])


def varying_slopes_log_prob(mu_b, sigma_b, a, b, sigma_y):
  return varying_slopes_model(floor, county).log_prob(
      [mu_b, sigma_b, a, b, sigma_y, log_radon])
@tf.function
def sample_varying_slopes(num_chains, num_results, num_burnin_steps):
  """Samples from the varying slopes model."""
  hmc = tfp.mcmc.HamiltonianMonteCarlo(
      target_log_prob_fn=varying_slopes_log_prob,
      num_leapfrog_steps=25,
      step_size=0.01)

  initial_state = [
      tf.zeros([num_chains], name='init_mu_b'),
      tf.ones([num_chains], name='init_sigma_b'),
      tf.zeros([num_chains], name='init_a'),
      tf.zeros([num_chains, num_counties], name='init_b'),
      tf.ones([num_chains], name='init_sigma_y')
  ]
  unconstraining_bijectors = [
      tfb.Identity(),  # mu_b
      tfb.Exp(),       # sigma_b
      tfb.Identity(),  # a
      tfb.Identity(),  # b
      tfb.Exp()        # sigma_y
  ]
  kernel = tfp.mcmc.TransformedTransitionKernel(
      inner_kernel=hmc, bijector=unconstraining_bijectors)
  samples, kernel_results = tfp.mcmc.sample_chain(
      num_results=num_results,
      num_burnin_steps=num_burnin_steps,
      current_state=initial_state,
      kernel=kernel)

  acceptance_probs = tf.reduce_mean(
      tf.cast(kernel_results.inner_results.is_accepted, tf.float32), axis=0)

  return samples, acceptance_probs
VaryingSlopesModel = collections.namedtuple(
    'VaryingSlopesModel', ['mu_b', 'sigma_b', 'a', 'b', 'sigma_y'])

samples, acceptance_probs = sample_varying_slopes(
    num_chains=4, num_results=1000, num_burnin_steps=1000)

print('Acceptance Probabilities: ', acceptance_probs.numpy())
varying_slopes_samples = VaryingSlopesModel._make(samples)
Acceptance Probabilities: [0.98 0.982 0.986 0.988]
for var in ['mu_b', 'sigma_b', 'a', 'sigma_y']:
  print(
      'R-hat for ', var, '\t: ',
      tfp.mcmc.potential_scale_reduction(getattr(varying_slopes_samples,
                                                 var)).numpy())
R-hat for  mu_b     :  1.0972525
R-hat for  sigma_b  :  1.1294962
R-hat for  a    :  1.0047072
R-hat for  sigma_y  :  1.0015919
varying_slopes_estimates = LinearEstimates(
    sample_mean(varying_slopes_samples.a),
    sample_mean(varying_slopes_samples.b))

plot_intercepts_and_slopes(varying_slopes_estimates,
                           'Log Radon Estimates (Varying Slopes)')
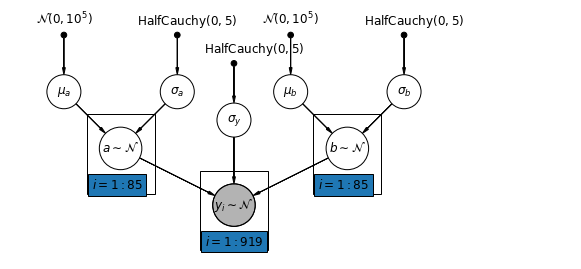
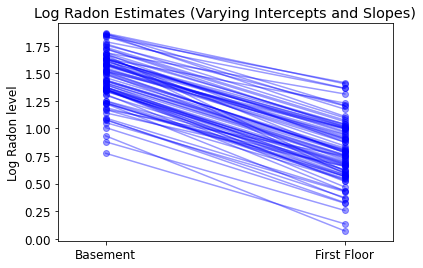
5.4 切片と勾配の変動
最も一般的なモデルでは、切片と勾配の両方を郡ごとに変えることができます。
$$y_i = \alpha_{j[i]} + \beta_{j[i]} x_{i} + \epsilon_i$$
mpl.rc("font", size=12)
pgm = daft.PGM([10, 4.5], node_unit=1.2)
pgm.add_node(
    daft.Node(
        "mu_a_prior",
        r"$\mathcal{N}(0, 10^5)$",
        1,
        4,
        fixed=True,
        offset=(0, 5)))
pgm.add_node(
    daft.Node(
        "sigma_a_prior",
        r"$\mathrm{HalfCauchy}(0, 5)$",
        3,
        4,
        fixed=True,
        offset=(10, 5)))
pgm.add_node(daft.Node("mu_a", r"$\mu_a$", 1, 3))
pgm.add_node(daft.Node("sigma_a", r"$\sigma_a$", 3, 3))
pgm.add_node(daft.Node("a", r"$a \sim \mathcal{N}$", 2, 2, scale=1.25))

pgm.add_node(
    daft.Node(
        "sigma_prior",
        r"$\mathrm{HalfCauchy}(0, 5)$",
        4,
        3.5,
        fixed=True,
        offset=(20, 5)))
pgm.add_node(daft.Node("sigma_y", r"$\sigma_y$", 4, 2.5))

pgm.add_node(
    daft.Node(
        "mu_b_prior",
        r"$\mathcal{N}(0, 10^5)$",
        5,
        4,
        fixed=True,
        offset=(0, 5)))
pgm.add_node(
    daft.Node(
        "sigma_b_prior",
        r"$\mathrm{HalfCauchy}(0, 5)$",
        7,
        4,
        fixed=True,
        offset=(10, 5)))
pgm.add_node(daft.Node("mu_b", r"$\mu_b$", 5, 3))
pgm.add_node(daft.Node("sigma_b", r"$\sigma_b$", 7, 3))
pgm.add_node(daft.Node("b", r"$b \sim \mathcal{N}$", 6, 2, scale=1.25))

pgm.add_node(
    daft.Node(
        "y_i", r"$y_i \sim \mathcal{N}$", 4, 1, scale=1.25, observed=True))
pgm.add_edge("mu_a_prior", "mu_a")
pgm.add_edge("sigma_a_prior", "sigma_a")
pgm.add_edge("mu_a", "a")
pgm.add_edge("sigma_a", "a")

pgm.add_edge("mu_b_prior", "mu_b")
pgm.add_edge("sigma_b_prior", "sigma_b")
pgm.add_edge("mu_b", "b")
pgm.add_edge("sigma_b", "b")

pgm.add_edge("sigma_prior", "sigma_y")

pgm.add_edge("sigma_y", "y_i")
pgm.add_edge("a", "y_i")
pgm.add_edge("b", "y_i")
pgm.add_plate(daft.Plate([1.4, 1.2, 1.2, 1.4], "$i = 1:85$"))
pgm.add_plate(daft.Plate([5.4, 1.2, 1.2, 1.4], "$i = 1:85$"))
pgm.add_plate(daft.Plate([3.4, 0.2, 1.2, 1.4], "$i = 1:919$"))

pgm.render()
plt.show()
def varying_intercepts_and_slopes_model(floor, county):
  """Creates a joint distribution for the varying slope model."""
  return tfd.JointDistributionSequential([
      tfd.Normal(loc=0., scale=1e5),    # mu_a
      tfd.HalfCauchy(loc=0., scale=5),  # sigma_a
      tfd.Normal(loc=0., scale=1e5),    # mu_b
      tfd.HalfCauchy(loc=0., scale=5),  # sigma_b
      lambda sigma_b, mu_b, sigma_a, mu_a: tfd.MultivariateNormalDiag(  # a
          loc=affine(tf.ones([num_counties]), mu_a[..., tf.newaxis]),
          scale_identity_multiplier=sigma_a),
      lambda _, sigma_b, mu_b: tfd.MultivariateNormalDiag(  # b
          loc=affine(tf.ones([num_counties]), mu_b[..., tf.newaxis]),
          scale_identity_multiplier=sigma_b),
      tfd.HalfCauchy(loc=0., scale=5),  # sigma_y
      lambda sigma_y, b, a: tfd.MultivariateNormalDiag(  # y
          loc=affine(floor, tf.gather(b, county, axis=-1),
                     tf.gather(a, county, axis=-1)),
          scale_identity_multiplier=sigma_y)
  ])


@tf.function
def varying_intercepts_and_slopes_log_prob(mu_a, sigma_a, mu_b, sigma_b, a, b,
                                           sigma_y):
  """Computes joint log prob pinned at `log_radon`."""
  return varying_intercepts_and_slopes_model(floor, county).log_prob(
      [mu_a, sigma_a, mu_b, sigma_b, a, b, sigma_y, log_radon])
@tf.function
def sample_varying_intercepts_and_slopes(num_chains, num_results,
                                         num_burnin_steps):
  """Samples from the varying intercepts and slopes model."""
  hmc = tfp.mcmc.HamiltonianMonteCarlo(
      target_log_prob_fn=varying_intercepts_and_slopes_log_prob,
      num_leapfrog_steps=50,
      step_size=0.01)

  initial_state = [
      tf.zeros([num_chains], name='init_mu_a'),
      tf.ones([num_chains], name='init_sigma_a'),
      tf.zeros([num_chains], name='init_mu_b'),
      tf.ones([num_chains], name='init_sigma_b'),
      tf.zeros([num_chains, num_counties], name='init_a'),
      tf.zeros([num_chains, num_counties], name='init_b'),
      tf.ones([num_chains], name='init_sigma_y')
  ]
  unconstraining_bijectors = [
      tfb.Identity(),  # mu_a
      tfb.Exp(),       # sigma_a
      tfb.Identity(),  # mu_b
      tfb.Exp(),       # sigma_b
      tfb.Identity(),  # a
      tfb.Identity(),  # b
      tfb.Exp()        # sigma_y
  ]
  kernel = tfp.mcmc.TransformedTransitionKernel(
      inner_kernel=hmc, bijector=unconstraining_bijectors)
  samples, kernel_results = tfp.mcmc.sample_chain(
      num_results=num_results,
      num_burnin_steps=num_burnin_steps,
      current_state=initial_state,
      kernel=kernel)

  acceptance_probs = tf.reduce_mean(
      tf.cast(kernel_results.inner_results.is_accepted, tf.float32), axis=0)

  return samples, acceptance_probs
VaryingInterceptsAndSlopesModel = collections.namedtuple(
    'VaryingInterceptsAndSlopesModel',
    ['mu_a', 'sigma_a', 'mu_b', 'sigma_b', 'a', 'b', 'sigma_y'])

samples, acceptance_probs = sample_varying_intercepts_and_slopes(
    num_chains=4, num_results=1000, num_burnin_steps=500)

print('Acceptance Probabilities: ', acceptance_probs.numpy())
varying_intercepts_and_slopes_samples = VaryingInterceptsAndSlopesModel._make(
    samples)
Acceptance Probabilities: [0.989 0.958 0.984 0.985]
for var in ['mu_a', 'sigma_a', 'mu_b', 'sigma_b']:
  print(
      'R-hat for ', var, '\t: ',
      tfp.mcmc.potential_scale_reduction(
          getattr(varying_intercepts_and_slopes_samples, var)).numpy())
R-hat for  mu_a     :  1.0002819
R-hat for  sigma_a  :  1.0014255
R-hat for  mu_b     :  1.0111941
R-hat for  sigma_b  :  1.0994663
varying_intercepts_and_slopes_estimates = LinearEstimates(
    sample_mean(varying_intercepts_and_slopes_samples.a),
    sample_mean(varying_intercepts_and_slopes_samples.b))

plot_intercepts_and_slopes(
    varying_intercepts_and_slopes_estimates,
    'Log Radon Estimates (Varying Intercepts and Slopes)')
forest_plot(
    num_chains=4,
    num_vars=num_counties,
    var_name='a',
    var_labels=county_name,
    samples=varying_intercepts_and_slopes_samples.a.numpy())
forest_plot(
    num_chains=4,
    num_vars=num_counties,
    var_name='b',
    var_labels=county_name,
    samples=varying_intercepts_and_slopes_samples.b.numpy())
6 グループレベルの予測子の追加
マルチレベルモデルの主な利点は、マルチレベルの予測子を同時に処理できることです。上記の変動切片モデルを検討すると、次のようになります。
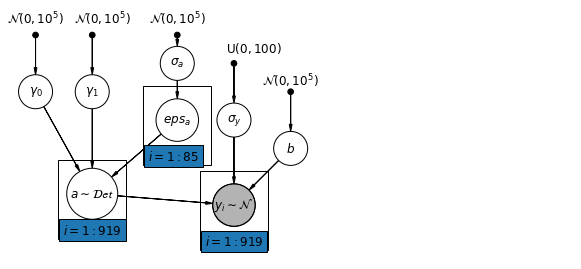
\(y_i = \alpha_{j[i]} + \beta x_{i} + \epsilon_i\) 予想されるラドン値の変動を説明する単純な変量効果の代わりに、郡レベルの共変量を持つ別の回帰モデルを指定することもできます。ここでは、ラドンレベルに関連すると考えられる郡のウラン測定値 \(u_j\) を使用します。
\(\alpha_j = \gamma_0 + \gamma_1 u_j + \zeta_j\)\(\zeta_j \sim N(0, \sigma_{\alpha}^2)\) 家屋レベルの予測子 (1 階または地下室) と郡レベルの予測子 (ウラン) を組み込みました。
モデルには、各郡の両方のインジケータ変数と、郡レベルの共変量があることに注意してください。古典的な回帰では、これは共線性をもたらします。マルチレベルモデルでは、グループレベルの線形モデルの期待値に向けて切片を部分的にプーリングすることで、これを回避できます。
グループレベルの予測子は、グループレベルの変動 \(\sigma_{\alpha}\) を減らすのにも役立ちます。そのため、グループレベルの予測がより強力なプーリングを誘発します。
6.1 Hierarchical Intercepts model
mpl.rc("font", size=12)
pgm = daft.PGM([10, 4.5], node_unit=1.2)
pgm.add_node(
    daft.Node(
        "gamma_0_prior",
        r"$\mathcal{N}(0, 10^5)$",
        0.5,
        4,
        fixed=True,
        offset=(0, 5)))
pgm.add_node(
    daft.Node(
        "gamma_1_prior",
        r"$\mathcal{N}(0, 10^5)$",
        1.5,
        4,
        fixed=True,
        offset=(10, 5)))
pgm.add_node(daft.Node("gamma_0", r"$\gamma_0$", 0.5, 3))
pgm.add_node(daft.Node("gamma_1", r"$\gamma_1$", 1.5, 3))
pgm.add_node(
    daft.Node(
        "sigma_a_prior",
        r"$\mathcal{N}(0, 10^5)$",
        3,
        4,
        fixed=True,
        offset=(0, 5)))
pgm.add_node(daft.Node("sigma_a", r"$\sigma_a$", 3, 3.5))
pgm.add_node(daft.Node("eps_a", r"$eps_a$", 3, 2.5, scale=1.25))
pgm.add_node(daft.Node("a", r"$a \sim \mathcal{Det}$", 1.5, 1.2, scale=1.5))

pgm.add_node(
    daft.Node(
        "sigma_prior",
        r"$\mathrm{U}(0, 100)$",
        4,
        3.5,
        fixed=True,
        offset=(20, 5)))
pgm.add_node(daft.Node("sigma_y", r"$\sigma_y$", 4, 2.5))
pgm.add_node(daft.Node("b_prior", r"$\mathcal{N}(0, 10^5)$", 5, 3, fixed=True))
pgm.add_node(daft.Node("b", r"$b$", 5, 2))

pgm.add_node(
    daft.Node(
        "y_i", r"$y_i \sim \mathcal{N}$", 4, 1, scale=1.25, observed=True))

pgm.add_edge("gamma_0_prior", "gamma_0")
pgm.add_edge("gamma_1_prior", "gamma_1")
pgm.add_edge("sigma_a_prior", "sigma_a")
pgm.add_edge("sigma_a", "eps_a")
pgm.add_edge("gamma_0", "a")
pgm.add_edge("gamma_1", "a")
pgm.add_edge("eps_a", "a")

pgm.add_edge("b_prior", "b")
pgm.add_edge("sigma_prior", "sigma_y")

pgm.add_edge("sigma_y", "y_i")
pgm.add_edge("a", "y_i")
pgm.add_edge("b", "y_i")
pgm.add_plate(daft.Plate([2.4, 1.7, 1.2, 1.4], "$i = 1:85$"))
pgm.add_plate(daft.Plate([0.9, 0.4, 1.2, 1.4], "$i = 1:919$"))
pgm.add_plate(daft.Plate([3.4, 0.2, 1.2, 1.4], "$i = 1:919$"))

pgm.render()
plt.show()
def hierarchical_intercepts_model(floor, county, log_uranium):
  """Creates a joint distribution for the varying slope model."""
  return tfd.JointDistributionSequential([
      tfd.HalfCauchy(loc=0., scale=5),  # sigma_a
      lambda sigma_a: tfd.MultivariateNormalDiag(  # eps_a
          loc=tf.zeros([num_counties]),
          scale_identity_multiplier=sigma_a),
      tfd.Normal(loc=0., scale=1e5),  # gamma_0
      tfd.Normal(loc=0., scale=1e5),  # gamma_1
      tfd.Normal(loc=0., scale=1e5),  # b
      tfd.Uniform(low=0., high=100),  # sigma_y
      lambda sigma_y, b, gamma_1, gamma_0, eps_a: tfd.
      MultivariateNormalDiag(  # y
          loc=affine(
              floor, b[..., tf.newaxis],
              affine(log_uranium, gamma_1[..., tf.newaxis],
                     gamma_0[..., tf.newaxis]) + tf.gather(eps_a, county, axis=-1)),
          scale_identity_multiplier=sigma_y)
  ])


def hierarchical_intercepts_log_prob(sigma_a, eps_a, gamma_0, gamma_1, b,
                                     sigma_y):
  """Computes joint log prob pinned at `log_radon`."""
  return hierarchical_intercepts_model(floor, county, log_uranium).log_prob(
      [sigma_a, eps_a, gamma_0, gamma_1, b, sigma_y, log_radon])
@tf.function
def sample_hierarchical_intercepts(num_chains, num_results, num_burnin_steps):
  """Samples from the hierarchical intercepts model."""
  hmc = tfp.mcmc.HamiltonianMonteCarlo(
      target_log_prob_fn=hierarchical_intercepts_log_prob,
      num_leapfrog_steps=10,
      step_size=0.01)

  initial_state = [
      tf.ones([num_chains], name='init_sigma_a'),
      tf.zeros([num_chains, num_counties], name='eps_a'),
      tf.zeros([num_chains], name='init_gamma_0'),
      tf.zeros([num_chains], name='init_gamma_1'),
      tf.zeros([num_chains], name='init_b'),
      tf.ones([num_chains], name='init_sigma_y')
  ]
  unconstraining_bijectors = [
      tfb.Exp(),       # sigma_a
      tfb.Identity(),  # eps_a
      tfb.Identity(),  # gamma_0
      tfb.Identity(),  # gamma_0
      tfb.Identity(),  # b
      # Maps reals to [0, 100].
      tfb.Chain([tfb.Shift(shift=50.),
                 tfb.Scale(scale=50.),
                 tfb.Tanh()])  # sigma_y
  ]
  kernel = tfp.mcmc.TransformedTransitionKernel(
      inner_kernel=hmc, bijector=unconstraining_bijectors)
  samples, kernel_results = tfp.mcmc.sample_chain(
      num_results=num_results,
      num_burnin_steps=num_burnin_steps,
      current_state=initial_state,
      kernel=kernel)

  acceptance_probs = tf.reduce_mean(
      tf.cast(kernel_results.inner_results.is_accepted, tf.float32), axis=0)

  return samples, acceptance_probs
HierarchicalInterceptsModel = collections.namedtuple(
    'HierarchicalInterceptsModel',
    ['sigma_a', 'eps_a', 'gamma_0', 'gamma_1', 'b', 'sigma_y'])

samples, acceptance_probs = sample_hierarchical_intercepts(
    num_chains=4, num_results=2000, num_burnin_steps=500)
print('Acceptance Probabilities: ', acceptance_probs.numpy())
hierarchical_intercepts_samples = HierarchicalInterceptsModel._make(samples)
Acceptance Probabilities: [0.956 0.959 0.9675 0.958 ]
for var in ['sigma_a', 'gamma_0', 'gamma_1', 'b', 'sigma_y']:
  print(
      'R-hat for', var, ':',
      tfp.mcmc.potential_scale_reduction(
          getattr(hierarchical_intercepts_samples, var)).numpy())
R-hat for sigma_a : 1.0204408
R-hat for gamma_0 : 1.0075455
R-hat for gamma_1 : 1.0054599
R-hat for b : 1.0011046
R-hat for sigma_y : 1.0004083
def plot_hierarchical_intercepts():
  mean_and_var = lambda x : [reduce_samples(x, fn) for fn in [np.mean, np.var]]
  gamma_0_mean, gamma_0_var = mean_and_var(
    hierarchical_intercepts_samples.gamma_0)
  gamma_1_mean, gamma_1_var = mean_and_var(
    hierarchical_intercepts_samples.gamma_1)
  eps_a_means, eps_a_vars  = mean_and_var(hierarchical_intercepts_samples.eps_a)

  mu_a_means = gamma_0_mean + gamma_1_mean * log_uranium
  mu_a_vars = gamma_0_var + np.square(log_uranium) * gamma_1_var
  a_means = mu_a_means + eps_a_means[county]
  a_stds = np.sqrt(mu_a_vars + eps_a_vars[county])

  plt.figure()
  plt.scatter(log_uranium, a_means, marker='.', c='C0')
  xvals = np.linspace(-1, 0.8)
  plt.plot(xvals,gamma_0_mean + gamma_1_mean * xvals, 'k--')
  plt.xlim(-1, 0.8)

  for ui, m, se in zip(log_uranium, a_means, a_stds):
    plt.plot([ui, ui], [m - se, m + se], 'C1-', alpha=0.1)
  plt.xlabel('County-level uranium')
  plt.ylabel('Intercept estimate')


plot_hierarchical_intercepts()
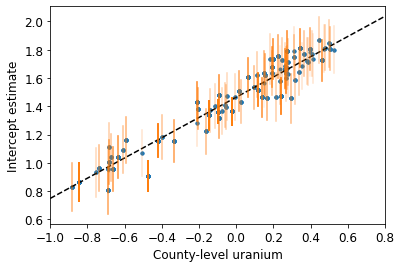
切片の標準誤差は、郡レベルの共変量のない部分プーリングモデルの場合よりも狭くなります。
6.2 レベル間の相関関係
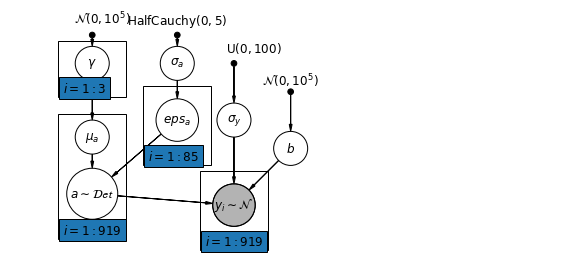
場合によっては、複数のレベルに予測子があると、個々のレベルの変数とグループの残差の間の相関関係が明らかになる可能性があります。これは、個々の予測子の平均を共変量としてグループ切片のモデルに含めることで説明できます。
\(\alpha_j = \gamma_0 + \gamma_1 u_j + \gamma_2 \bar{x} + \zeta_j\) これらは、広くコンテキスト効果と呼ばれます。
mpl.rc("font", size=12)
pgm = daft.PGM([10, 4.5], node_unit=1.2)
pgm.add_node(
    daft.Node(
        "gamma_prior",
        r"$\mathcal{N}(0, 10^5)$",
        1.5,
        4,
        fixed=True,
        offset=(10, 5)))
pgm.add_node(daft.Node("gamma", r"$\gamma$", 1.5, 3.5))
pgm.add_node(daft.Node("mu_a", r"$\mu_a$", 1.5, 2.2))
pgm.add_node(
    daft.Node(
        "sigma_a_prior",
        r"$\mathrm{HalfCauchy}(0, 5)$",
        3,
        4,
        fixed=True,
        offset=(0, 5)))
pgm.add_node(daft.Node("sigma_a", r"$\sigma_a$", 3, 3.5))
pgm.add_node(daft.Node("eps_a", r"$eps_a$", 3, 2.5, scale=1.25))
pgm.add_node(daft.Node("a", r"$a \sim \mathcal{Det}$", 1.5, 1.2, scale=1.5))

pgm.add_node(
    daft.Node(
        "sigma_prior",
        r"$\mathrm{U}(0, 100)$",
        4,
        3.5,
        fixed=True,
        offset=(20, 5)))
pgm.add_node(daft.Node("sigma_y", r"$\sigma_y$", 4, 2.5))
pgm.add_node(daft.Node("b_prior", r"$\mathcal{N}(0, 10^5)$", 5, 3, fixed=True))
pgm.add_node(daft.Node("b", r"$b$", 5, 2))

pgm.add_node(
    daft.Node(
        "y_i", r"$y_i \sim \mathcal{N}$", 4, 1, scale=1.25, observed=True))

pgm.add_edge("gamma_prior", "gamma")
pgm.add_edge("sigma_a_prior", "sigma_a")
pgm.add_edge("sigma_a", "eps_a")
pgm.add_edge("gamma", "mu_a")
pgm.add_edge("mu_a", "a")
pgm.add_edge("eps_a", "a")

pgm.add_edge("b_prior", "b")
pgm.add_edge("sigma_prior", "sigma_y")

pgm.add_edge("sigma_y", "y_i")
pgm.add_edge("a", "y_i")
pgm.add_edge("b", "y_i")
pgm.add_plate(daft.Plate([0.9, 2.9, 1.2, 1.0], "$i = 1:3$"))
pgm.add_plate(daft.Plate([2.4, 1.7, 1.2, 1.4], "$i = 1:85$"))
pgm.add_plate(daft.Plate([0.9, 0.4, 1.2, 2.2], "$i = 1:919$"))
pgm.add_plate(daft.Plate([3.4, 0.2, 1.2, 1.4], "$i = 1:919$"))

pgm.render()
plt.show()
# Create a new variable for mean of floor across counties
xbar = tf.convert_to_tensor(radon.groupby('county')['floor'].mean(), tf.float32)
xbar = tf.gather(xbar, county, axis=-1)
def contextual_effects_model(floor, county, log_uranium, xbar):
  """Creates a joint distribution for the varying slope model."""
  return tfd.JointDistributionSequential([
      tfd.HalfCauchy(loc=0., scale=5),  # sigma_a
      lambda sigma_a: tfd.MultivariateNormalDiag(  # eps_a
          loc=tf.zeros([num_counties]),
          scale_diag=sigma_a[..., tf.newaxis] * tf.ones([num_counties])),
      tfd.Normal(loc=0., scale=1e5),  # gamma_0
      tfd.Normal(loc=0., scale=1e5),  # gamma_1
      tfd.Normal(loc=0., scale=1e5),  # gamma_2
      tfd.Normal(loc=0., scale=1e5),  # b
      tfd.Uniform(low=0., high=100),  # sigma_y
      lambda sigma_y, b, gamma_2, gamma_1, gamma_0, eps_a: tfd.
      MultivariateNormalDiag(  # y
          loc=affine(
              floor, b[..., tf.newaxis],
              affine(log_uranium, gamma_1[..., tf.newaxis], gamma_0[
                  ..., tf.newaxis]) + affine(xbar, gamma_2[..., tf.newaxis]) +
              tf.gather(eps_a, county, axis=-1)),
          scale_diag=sigma_y[..., tf.newaxis] * tf.ones_like(xbar))
  ])


def contextual_effects_log_prob(sigma_a, eps_a, gamma_0, gamma_1, gamma_2, b,
                                sigma_y):
  """Computes joint log prob pinned at `log_radon`."""
  return contextual_effects_model(floor, county, log_uranium, xbar).log_prob(
      [sigma_a, eps_a, gamma_0, gamma_1, gamma_2, b, sigma_y, log_radon])
@tf.function
def sample_contextual_effects(num_chains, num_results, num_burnin_steps):
  """Samples from the hierarchical intercepts model."""
  hmc = tfp.mcmc.HamiltonianMonteCarlo(
      target_log_prob_fn=contextual_effects_log_prob,
      num_leapfrog_steps=10,
      step_size=0.01)

  initial_state = [
      tf.ones([num_chains], name='init_sigma_a'),
      tf.zeros([num_chains, num_counties], name='eps_a'),
      tf.zeros([num_chains], name='init_gamma_0'),
      tf.zeros([num_chains], name='init_gamma_1'),
      tf.zeros([num_chains], name='init_gamma_2'),
      tf.zeros([num_chains], name='init_b'),
      tf.ones([num_chains], name='init_sigma_y')
  ]
  unconstraining_bijectors = [
      tfb.Exp(),       # sigma_a
      tfb.Identity(),  # eps_a
      tfb.Identity(),  # gamma_0
      tfb.Identity(),  # gamma_1
      tfb.Identity(),  # gamma_2
      tfb.Identity(),  # b
      tfb.Chain([tfb.Shift(shift=50.),
                 tfb.Scale(scale=50.),
                 tfb.Tanh()])  # sigma_y
  ]
  kernel = tfp.mcmc.TransformedTransitionKernel(
      inner_kernel=hmc, bijector=unconstraining_bijectors)
  samples, kernel_results = tfp.mcmc.sample_chain(
      num_results=num_results,
      num_burnin_steps=num_burnin_steps,
      current_state=initial_state,
      kernel=kernel)

  acceptance_probs = tf.reduce_mean(
      tf.cast(kernel_results.inner_results.is_accepted, tf.float32), axis=0)

  return samples, acceptance_probs
ContextualEffectsModel = collections.namedtuple(
    'ContextualEffectsModel',
    ['sigma_a', 'eps_a', 'gamma_0', 'gamma_1', 'gamma_2', 'b', 'sigma_y'])

samples, acceptance_probs = sample_contextual_effects(
    num_chains=4, num_results=2000, num_burnin_steps=500)
print('Acceptance Probabilities: ', acceptance_probs.numpy())
contextual_effects_samples = ContextualEffectsModel._make(samples)
Acceptance Probabilities: [0.948 0.952 0.956 0.953]
for var in ['sigma_a', 'gamma_0', 'gamma_1', 'gamma_2', 'b', 'sigma_y']:
  print(
      'R-hat for ', var, ': ',
      tfp.mcmc.potential_scale_reduction(
          getattr(contextual_effects_samples, var)).numpy())
R-hat for  sigma_a :  1.1393573
R-hat for  gamma_0 :  1.0081229
R-hat for  gamma_1 :  1.0007668
R-hat for  gamma_2 :  1.012864
R-hat for  b :  1.0019505
R-hat for  sigma_y :  1.0056173
for var in ['gamma_0', 'gamma_1', 'gamma_2']:
  var_samples = getattr(contextual_effects_samples, var)
  mean = var_samples.numpy().mean()
  std = var_samples.numpy().std()
  r_hat = tfp.mcmc.potential_scale_reduction(var_samples).numpy()
  n_eff = tfp.mcmc.effective_sample_size(var_samples).numpy().sum()

  print(var, ' mean: ', mean, ' std: ', std, ' n_eff: ', n_eff, ' r_hat: ',
        r_hat)
gamma_0  mean:  1.3939122  std:  0.051875897  n_eff:  572.4374  r_hat:  1.0081229
gamma_1  mean:  0.7207277  std:  0.090660274  n_eff:  727.2628  r_hat:  1.0007668
gamma_2  mean:  0.40686083  std:  0.20155264  n_eff:  381.74048  r_hat:  1.012864
したがって、このことから、地下室のない家の割合が高い郡では、ラドンのベースラインレベルが高くなる傾向があると推測できます。おそらくこれは土壌タイプに関連しており、それがどのような構造物を構築するかに影響を与える可能性があります。
6.3 予測
Gelman (2006) は、交差検定テストを使用して、プールされていないモデル、プールされているモデル、および部分的にプールされているモデルの予測誤差を確認しました。
二乗平均平方根交差検定予測誤差:
- プーリングなし = 0.86
- プーリングあり = 0.84
- マルチレベル = 0.79
マルチレベルモデルで実行できる予測には、次の 2 つのタイプがあります。
- 既存のグループ内の新しい個々のケース
- 新しいグループ内の新しい個々のケース
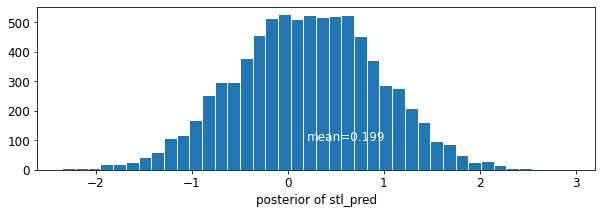
たとえば、セントルイス郡にある地下室のない新しい家の予測を行う場合は、適切な切片を使用してラドンモデルからサンプリングする必要があります。
county_name.index('St Louis')
69
以下のとおりです。
\[\tilde{y}_i \sim N(\alpha_{69} + \beta (x_i=1), \sigma_y^2)\]
st_louis_log_uranium = tf.convert_to_tensor(
    radon.where(radon['county'] == 69)['log_uranium_ppm'].mean(), tf.float32)
st_louis_xbar = tf.convert_to_tensor(
    radon.where(radon['county'] == 69)['floor'].mean(), tf.float32)
@tf.function
def intercept_a(gamma_0, gamma_1, gamma_2, eps_a, log_uranium, xbar, county):
  return (affine(log_uranium, gamma_1, gamma_0) + affine(xbar, gamma_2) +
          tf.gather(eps_a, county, axis=-1))


def contextual_effects_predictive_model(floor, county, log_uranium, xbar,
                                        st_louis_log_uranium, st_louis_xbar):
  """Creates a joint distribution for the contextual effects model."""
  return tfd.JointDistributionSequential([
      tfd.HalfCauchy(loc=0., scale=5),  # sigma_a
      lambda sigma_a: tfd.MultivariateNormalDiag(  # eps_a
          loc=tf.zeros([num_counties]),
          scale_diag=sigma_a[..., tf.newaxis] * tf.ones([num_counties])),
      tfd.Normal(loc=0., scale=1e5),  # gamma_0
      tfd.Normal(loc=0., scale=1e5),  # gamma_1
      tfd.Normal(loc=0., scale=1e5),  # gamma_2
      tfd.Normal(loc=0., scale=1e5),  # b
      tfd.Uniform(low=0., high=100),  # sigma_y
      # y
      lambda sigma_y, b, gamma_2, gamma_1, gamma_0, eps_a: (
        tfd.MultivariateNormalDiag(
          loc=affine(
              floor, b[..., tf.newaxis],
              intercept_a(gamma_0[..., tf.newaxis],
                          gamma_1[..., tf.newaxis], gamma_2[..., tf.newaxis],
                          eps_a, log_uranium, xbar, county)),
          scale_diag=sigma_y[..., tf.newaxis] * tf.ones_like(xbar))),
      # stl_pred
      lambda _, sigma_y, b, gamma_2, gamma_1, gamma_0, eps_a: tfd.Normal(
          loc=intercept_a(gamma_0, gamma_1, gamma_2, eps_a,
                          st_louis_log_uranium, st_louis_xbar, 69) + b,
          scale=sigma_y)
  ])


@tf.function
def contextual_effects_predictive_log_prob(sigma_a, eps_a, gamma_0, gamma_1,
                                           gamma_2, b, sigma_y, stl_pred):
  """Computes joint log prob pinned at `log_radon`."""
  return contextual_effects_predictive_model(floor, county, log_uranium, xbar,
                                             st_louis_log_uranium,
                                             st_louis_xbar).log_prob([
                                                 sigma_a, eps_a, gamma_0,
                                                 gamma_1, gamma_2, b, sigma_y,
                                                 log_radon, stl_pred
                                             ])
@tf.function
def sample_contextual_effects_predictive(num_chains, num_results,
                                         num_burnin_steps):
  """Samples from the contextual effects predictive model."""
  hmc = tfp.mcmc.HamiltonianMonteCarlo(
      target_log_prob_fn=contextual_effects_predictive_log_prob,
      num_leapfrog_steps=50,
      step_size=0.01)

  initial_state = [
      tf.ones([num_chains], name='init_sigma_a'),
      tf.zeros([num_chains, num_counties], name='eps_a'),
      tf.zeros([num_chains], name='init_gamma_0'),
      tf.zeros([num_chains], name='init_gamma_1'),
      tf.zeros([num_chains], name='init_gamma_2'),
      tf.zeros([num_chains], name='init_b'),
      tf.ones([num_chains], name='init_sigma_y'),
      tf.zeros([num_chains], name='init_stl_pred')
  ]
  unconstraining_bijectors = [
      tfb.Exp(),       # sigma_a
      tfb.Identity(),  # eps_a
      tfb.Identity(),  # gamma_0
      tfb.Identity(),  # gamma_1
      tfb.Identity(),  # gamma_2
      tfb.Identity(),  # b
      tfb.Chain([tfb.Shift(shift=50.),
                 tfb.Scale(scale=50.),
                 tfb.Tanh()]),  # sigma_y
      tfb.Identity(),  # stl_pred
  ]
  kernel = tfp.mcmc.TransformedTransitionKernel(
      inner_kernel=hmc, bijector=unconstraining_bijectors)
  samples, kernel_results = tfp.mcmc.sample_chain(
      num_results=num_results,
      num_burnin_steps=num_burnin_steps,
      current_state=initial_state,
      kernel=kernel)

  acceptance_probs = tf.reduce_mean(
      tf.cast(kernel_results.inner_results.is_accepted, tf.float32), axis=0)

  return samples, acceptance_probs
ContextualEffectsPredictiveModel = collections.namedtuple(
    'ContextualEffectsPredictiveModel', [
        'sigma_a', 'eps_a', 'gamma_0', 'gamma_1', 'gamma_2', 'b', 'sigma_y',
        'stl_pred'
    ])

samples, acceptance_probs = sample_contextual_effects_predictive(
    num_chains=4, num_results=2000, num_burnin_steps=500)
print('Acceptance Probabilities: ', acceptance_probs.numpy())
contextual_effects_pred_samples = ContextualEffectsPredictiveModel._make(
    samples)
Acceptance Probabilities: [0.981 0.9795 0.972 0.9705]
for var in [
    'sigma_a', 'gamma_0', 'gamma_1', 'gamma_2', 'b', 'sigma_y', 'stl_pred'
]:
  print(
      'R-hat for ', var, ': ',
      tfp.mcmc.potential_scale_reduction(
          getattr(contextual_effects_pred_samples, var)).numpy())
R-hat for  sigma_a :  1.0053602
R-hat for  gamma_0 :  1.0008001
R-hat for  gamma_1 :  1.0015156
R-hat for  gamma_2 :  0.99972683
R-hat for  b :  1.0045198
R-hat for  sigma_y :  1.0114483
R-hat for  stl_pred :  1.0045049
plot_traces('stl_pred', contextual_effects_pred_samples.stl_pred, num_chains=4)

plot_posterior('stl_pred', contextual_effects_pred_samples.stl_pred)
7 結論
マルチレベルモデルの利点は以下のとおりです。
- 観測データの自然な階層構造を説明する。
- (サンプルの少ない) グループの係数を推定する。
- グループレベルの係数を推定するときに、個々のレベルおよびグループレベルの情報を組み込む。
- グループ間での個々のレベルの係数間の変動を考慮する。
参照文献
Gelman, A., & Hill, J. (2006). Data Analysis Using Regression and Multilevel/Hierarchical Models (1st ed.). Cambridge University Press.
Gelman, A. (2006). Multilevel (Hierarchical) modeling: what it can and cannot do. Technometrics, 48(3), 432–435.
