इस उदाहरण PyMC3 उदाहरण नोटबुक से मोड़ा जाता है बहुस्तरीय मॉडलिंग के लिए बायेसियन तरीके पर एक प्राइमर
 TensorFlow.org पर देखें TensorFlow.org पर देखें |  Google Colab में चलाएं Google Colab में चलाएं |  GitHub पर स्रोत देखें GitHub पर स्रोत देखें |  नोटबुक डाउनलोड करें नोटबुक डाउनलोड करें |
निर्भरता और पूर्वापेक्षाएँ
आयात
import collections
import os
from six.moves import urllib
import daft as daft
import matplotlib as mpl
import matplotlib.pyplot as plt
import numpy as np
import pandas as pd
import seaborn as sns
import warnings

import tensorflow.compat.v2 as tf
tf.enable_v2_behavior()

import tensorflow_datasets as tfds
import tensorflow_probability as tfp

tfk = tf.keras
tfkl = tf.keras.layers
tfpl = tfp.layers
tfd = tfp.distributions
tfb = tfp.bijectors

warnings.simplefilter('ignore')
1 परिचय
इस colab हम लोकप्रिय रेडॉन डेटासेट का उपयोग करके श्रेणीबद्ध रैखिक मॉडल मॉडल जटिलता के विभिन्न डिग्री (HLMs) फिट होगा। हम TFP प्रिमिटिव और इसके मार्कोव चेन मोंटे कार्लो टूलसेट का उपयोग करेंगे।
डेटा को बेहतर ढंग से फिट करने के लिए, हमारा लक्ष्य डेटासेट में मौजूद प्राकृतिक पदानुक्रमित संरचना का उपयोग करना है। हम पारंपरिक दृष्टिकोण से शुरू करते हैं: पूरी तरह से पूल किए गए और अनपूल किए गए मॉडल। हम बहुस्तरीय मॉडल के साथ जारी रखते हैं: आंशिक पूलिंग मॉडल, समूह-स्तरीय भविष्यवाणियों और प्रासंगिक प्रभावों की खोज करना।
एक संबंधित नोटबुक के लिए भी रेडॉन डेटासेट पर TFP का उपयोग कर HLMs फिटिंग, बाहर की जाँच {TF संभावना, अनुसंधान, स्टेन} में रैखिक मिश्रित प्रभाव प्रतिगमन ।
आप यहाँ सामग्री के बारे में कोई प्रश्न हैं, संपर्क करने में संकोच नहीं है (या सम्मिलित हों) TensorFlow संभावना मेलिंग सूची । हमें मदद करने में खुशी हो रही है.
2 बहुस्तरीय मॉडलिंग अवलोकन
बहुस्तरीय मॉडलिंग के लिए बायेसियन विधियों पर एक प्राइमर
पदानुक्रमित या बहुस्तरीय मॉडलिंग प्रतिगमन मॉडलिंग का एक सामान्यीकरण है।
बहुस्तरीय मॉडल प्रतिगमन मॉडल हैं जिसमें घटक मॉडल मापदंडों को संभाव्यता वितरण दिया जाता है। इसका तात्पर्य यह है कि मॉडल मापदंडों को समूह द्वारा भिन्न होने की अनुमति है। प्रेक्षणात्मक इकाइयाँ अक्सर स्वाभाविक रूप से क्लस्टर की जाती हैं। समूहों के यादृच्छिक नमूने और समूहों के भीतर यादृच्छिक नमूने के बावजूद, क्लस्टरिंग टिप्पणियों के बीच निर्भरता को प्रेरित करता है।
एक पदानुक्रमित मॉडल एक विशेष बहुस्तरीय मॉडल है जहां पैरामीटर एक दूसरे के भीतर निहित होते हैं। कुछ बहुस्तरीय संरचनाएं श्रेणीबद्ध नहीं हैं।
उदाहरण के लिए "देश" और "वर्ष" नेस्टेड नहीं हैं, लेकिन अलग-अलग, लेकिन अतिव्यापी, मापदंडों के समूहों का प्रतिनिधित्व कर सकते हैं हम एक पर्यावरण महामारी विज्ञान उदाहरण का उपयोग करके इस विषय को प्रेरित करेंगे।
उदाहरण: रेडॉन संदूषण (जेलमैन और हिल 2006)
रेडॉन एक रेडियोधर्मी गैस है जो जमीन के संपर्क बिंदुओं के माध्यम से घरों में प्रवेश करती है। यह एक कार्सिनोजेन है जो धूम्रपान न करने वालों में फेफड़ों के कैंसर का प्राथमिक कारण है। रेडॉन का स्तर घर-घर में बहुत भिन्न होता है।
EPA ने 80,000 घरों में रेडॉन के स्तर का अध्ययन किया। दो महत्वपूर्ण भविष्यवाणियां हैं: 1. तहखाने या पहली मंजिल में माप (तहखाने में रेडॉन उच्च) 2. काउंटी यूरेनियम स्तर (रेडॉन स्तरों के साथ सकारात्मक सहसंबंध)
हम मिनेसोटा में रेडॉन स्तरों के मॉडलिंग पर ध्यान केंद्रित करेंगे। इस उदाहरण में पदानुक्रम प्रत्येक काउंटी के घरों में है।
3 डेटा मुंगिंग
इस भाग में हम प्राप्त radon डाटासेट और कुछ न्यूनतम preprocessing है।
def load_and_preprocess_radon_dataset(state='MN'):
  """Preprocess Radon dataset as done in "Bayesian Data Analysis" book.

  We filter to Minnesota data (919 examples) and preprocess to obtain the
  following features:
  - `log_uranium_ppm`: Log of soil uranium measurements.
  - `county`: Name of county in which the measurement was taken.
  - `floor`: Floor of house (0 for basement, 1 for first floor) on which the
    measurement was taken.

  The target variable is `log_radon`, the log of the Radon measurement in the
  house.
  """
  ds = tfds.load('radon', split='train')
  radon_data = tfds.as_dataframe(ds)
  radon_data.rename(lambda s: s[9:] if s.startswith('feat') else s, axis=1, inplace=True)
  df = radon_data[radon_data.state==state.encode()].copy()

  # For any missing or invalid activity readings, we'll use a value of `0.1`.
  df['radon'] = df.activity.apply(lambda x: x if x > 0. else 0.1)
  # Make county names look nice.
  df['county'] = df.county.apply(lambda s: s.decode()).str.strip().str.title()
  # Remap categories to start from 0 and end at max(category).
  county_name = sorted(df.county.unique())
  df['county'] = df.county.astype(
      pd.api.types.CategoricalDtype(categories=county_name)).cat.codes
  county_name = list(map(str.strip, county_name))

  df['log_radon'] = df['radon'].apply(np.log)
  df['log_uranium_ppm'] = df['Uppm'].apply(np.log)
  df = df[['idnum', 'log_radon', 'floor', 'county', 'log_uranium_ppm']]

  return df, county_name
radon, county_name = load_and_preprocess_radon_dataset()
num_counties = len(county_name)
num_observations = len(radon)
# Create copies of variables as Tensors.
county = tf.convert_to_tensor(radon['county'], dtype=tf.int32)
floor = tf.convert_to_tensor(radon['floor'], dtype=tf.float32)
log_radon = tf.convert_to_tensor(radon['log_radon'], dtype=tf.float32)
log_uranium = tf.convert_to_tensor(radon['log_uranium_ppm'], dtype=tf.float32)
radon.head()
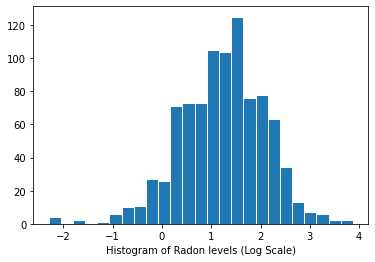
रेडॉन स्तरों का वितरण (लॉग स्केल):
plt.hist(log_radon.numpy(), bins=25, edgecolor='white')
plt.xlabel("Histogram of Radon levels (Log Scale)")
plt.show()
4 पारंपरिक दृष्टिकोण
रेडॉन एक्सपोजर मॉडलिंग के दो पारंपरिक विकल्प पूर्वाग्रह-विचरण व्यापार के दो चरम सीमाओं का प्रतिनिधित्व करते हैं:
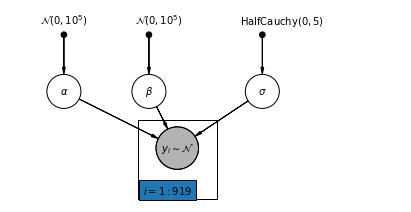
पूरी पूलिंग:
सभी काउंटियों के साथ समान व्यवहार करें, और एकल रेडॉन स्तर का अनुमान लगाएं।
\[y_i = \alpha + \beta x_i + \epsilon_i\]
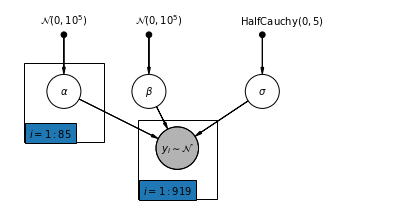
कोई पूलिंग नहीं:
प्रत्येक काउंटी में स्वतंत्र रूप से मॉडल रेडॉन।
\(y_i = \alpha_{j[i]} + \beta x_i + \epsilon_i\) जहां \(j = 1,\ldots,85\)
त्रुटियों \(\epsilon_i\) घरों के बीच माप त्रुटि, अस्थायी भीतर घर में भिन्नता, या विविधता का प्रतिनिधित्व कर सकते हैं।
4.1 पूर्ण पूलिंग मॉडल
pgm = daft.PGM([7, 3.5], node_unit=1.2)
pgm.add_node(
    daft.Node(
        "alpha_prior",
        r"$\mathcal{N}(0, 10^5)$",
        1,
        3,
        fixed=True,
        offset=(0, 5)))
pgm.add_node(
    daft.Node(
        "beta_prior",
        r"$\mathcal{N}(0, 10^5)$",
        2.5,
        3,
        fixed=True,
        offset=(10, 5)))
pgm.add_node(
    daft.Node(
        "sigma_prior",
        r"$\mathrm{HalfCauchy}(0, 5)$",
        4.5,
        3,
        fixed=True,
        offset=(20, 5)))
pgm.add_node(daft.Node("alpha", r"$\alpha$", 1, 2))
pgm.add_node(daft.Node("beta", r"$\beta$", 2.5, 2))
pgm.add_node(daft.Node("sigma", r"$\sigma$", 4.5, 2))
pgm.add_node(
    daft.Node(
        "y_i", r"$y_i \sim \mathcal{N}$", 3, 1, scale=1.25, observed=True))
pgm.add_edge("alpha_prior", "alpha")
pgm.add_edge("beta_prior", "beta")
pgm.add_edge("sigma_prior", "sigma")
pgm.add_edge("sigma", "y_i")
pgm.add_edge("alpha", "y_i")
pgm.add_edge("beta", "y_i")
pgm.add_plate(daft.Plate([2.3, 0.1, 1.4, 1.4], "$i = 1:919$"))

pgm.render()
plt.show()
नीचे, हम हैमिल्टनियन मोंटे कार्लो का उपयोग करके पूर्ण पूलिंग मॉडल फिट करते हैं।
@tf.function
def affine(x, kernel_diag, bias=tf.zeros([])):
  """`kernel_diag * x + bias` with broadcasting."""
  kernel_diag = tf.ones_like(x) * kernel_diag
  bias = tf.ones_like(x) * bias
  return x * kernel_diag + bias
def pooled_model(floor):
  """Creates a joint distribution representing our generative process."""
  return tfd.JointDistributionSequential([
      tfd.Normal(loc=0., scale=1e5),  # alpha
      tfd.Normal(loc=0., scale=1e5),  # beta
      tfd.HalfCauchy(loc=0., scale=5),  # sigma
      lambda s, b1, b0: tfd.MultivariateNormalDiag(  # y
          loc=affine(floor, b1[..., tf.newaxis], b0[..., tf.newaxis]),
          scale_identity_multiplier=s)
  ])


@tf.function
def pooled_log_prob(alpha, beta, sigma):
  """Computes `joint_log_prob` pinned at `log_radon`."""
  return pooled_model(floor).log_prob([alpha, beta, sigma, log_radon])
@tf.function
def sample_pooled(num_chains, num_results, num_burnin_steps, num_observations):
  """Samples from the pooled model."""
  hmc = tfp.mcmc.HamiltonianMonteCarlo(
      target_log_prob_fn=pooled_log_prob,
      num_leapfrog_steps=10,
      step_size=0.005)

  initial_state = [
      tf.zeros([num_chains], name='init_alpha'),
      tf.zeros([num_chains], name='init_beta'),
      tf.ones([num_chains], name='init_sigma')
  ]

  # Constrain `sigma` to the positive real axis. Other variables are
  # unconstrained.
  unconstraining_bijectors = [
      tfb.Identity(),  # alpha
      tfb.Identity(),  # beta
      tfb.Exp()        # sigma
  ]
  kernel = tfp.mcmc.TransformedTransitionKernel(
      inner_kernel=hmc, bijector=unconstraining_bijectors)

  samples, kernel_results = tfp.mcmc.sample_chain(
      num_results=num_results,
      num_burnin_steps=num_burnin_steps,
      current_state=initial_state,
      kernel=kernel)

  acceptance_probs = tf.reduce_mean(
      tf.cast(kernel_results.inner_results.is_accepted, tf.float32), axis=0)

  return samples, acceptance_probs
PooledModel = collections.namedtuple('PooledModel', ['alpha', 'beta', 'sigma'])

samples, acceptance_probs = sample_pooled(
    num_chains=4,
    num_results=1000,
    num_burnin_steps=1000,
    num_observations=num_observations)

print('Acceptance Probabilities for each chain: ', acceptance_probs.numpy())
pooled_samples = PooledModel._make(samples)
Acceptance Probabilities for each chain: [0.997 0.99 0.997 0.995]
for var, var_samples in pooled_samples._asdict().items():
  print('R-hat for ', var, ':\t',
        tfp.mcmc.potential_scale_reduction(var_samples).numpy())
R-hat for  alpha :     1.0046891
R-hat for  beta :  1.0128309
R-hat for  sigma :     1.0010641
def reduce_samples(var_samples, reduce_fn):
  """Reduces across leading two dims using reduce_fn."""
  # Collapse the first two dimensions, typically (num_chains, num_samples), and
  # compute np.mean or np.std along the remaining axis.
  if isinstance(var_samples, tf.Tensor):
    var_samples = var_samples.numpy() # convert to numpy array
  var_samples = np.reshape(var_samples, (-1,) +  var_samples.shape[2:])
  return np.apply_along_axis(reduce_fn, axis=0, arr=var_samples)

sample_mean = lambda samples : reduce_samples(samples, np.mean)
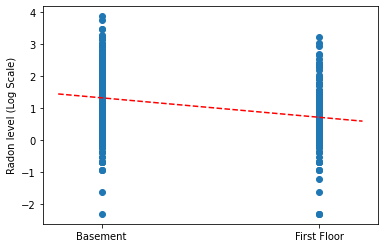
संपूर्ण पूलिंग मॉडल के लिए ढलान और अवरोधन के बिंदु अनुमानों को प्लॉट करें।
LinearEstimates = collections.namedtuple('LinearEstimates',
                                        ['intercept', 'slope'])

pooled_estimate = LinearEstimates(
  intercept=sample_mean(pooled_samples.alpha),
  slope=sample_mean(pooled_samples.beta)
)

plt.scatter(radon.floor, radon.log_radon)
xvals = np.linspace(-0.2, 1.2)
plt.ylabel('Radon level (Log Scale)')
plt.xticks([0, 1], ['Basement', 'First Floor'])
plt.plot(xvals, pooled_estimate.intercept + pooled_estimate.slope * xvals, 'r--')
plt.show()
नमूना चर के निशान प्लॉट करने के लिए उपयोगिता कार्य।
def plot_traces(var_name, samples, num_chains):
  if isinstance(samples, tf.Tensor):
    samples = samples.numpy() # convert to numpy array
  fig, axes = plt.subplots(1, 2, figsize=(14, 1.5), sharex='col', sharey='col')
  for chain in range(num_chains):
    axes[0].plot(samples[:, chain], alpha=0.7)
    axes[0].title.set_text("'{}' trace".format(var_name))
    sns.kdeplot(samples[:, chain], ax=axes[1], shade=False)
    axes[1].title.set_text("'{}' distribution".format(var_name))
    axes[0].set_xlabel('Iteration')
    axes[1].set_xlabel(var_name)
  plt.show()
for var, var_samples in pooled_samples._asdict().items():
  plot_traces(var, samples=var_samples, num_chains=4)


इसके बाद, हम अनपूल किए गए मॉडल में प्रत्येक काउंटी के लिए रेडॉन स्तर का अनुमान लगाते हैं।
4.2 अनपूल मॉडल
pgm = daft.PGM([7, 3.5], node_unit=1.2)
pgm.add_node(
    daft.Node(
        "alpha_prior",
        r"$\mathcal{N}(0, 10^5)$",
        1,
        3,
        fixed=True,
        offset=(0, 5)))
pgm.add_node(
    daft.Node(
        "beta_prior",
        r"$\mathcal{N}(0, 10^5)$",
        2.5,
        3,
        fixed=True,
        offset=(10, 5)))
pgm.add_node(
    daft.Node(
        "sigma_prior",
        r"$\mathrm{HalfCauchy}(0, 5)$",
        4.5,
        3,
        fixed=True,
        offset=(20, 5)))
pgm.add_node(daft.Node("alpha", r"$\alpha$", 1, 2))
pgm.add_node(daft.Node("beta", r"$\beta$", 2.5, 2))
pgm.add_node(daft.Node("sigma", r"$\sigma$", 4.5, 2))
pgm.add_node(
    daft.Node(
        "y_i", r"$y_i \sim \mathcal{N}$", 3, 1, scale=1.25, observed=True))
pgm.add_edge("alpha_prior", "alpha")
pgm.add_edge("beta_prior", "beta")
pgm.add_edge("sigma_prior", "sigma")
pgm.add_edge("sigma", "y_i")
pgm.add_edge("alpha", "y_i")
pgm.add_edge("beta", "y_i")
pgm.add_plate(daft.Plate([0.3, 1.1, 1.4, 1.4], "$i = 1:85$"))
pgm.add_plate(daft.Plate([2.3, 0.1, 1.4, 1.4], "$i = 1:919$"))

pgm.render()
plt.show()
def unpooled_model(floor, county):
  """Creates a joint distribution for the unpooled model."""
  return tfd.JointDistributionSequential([
      tfd.MultivariateNormalDiag(       # alpha
          loc=tf.zeros([num_counties]), scale_identity_multiplier=1e5),
      tfd.Normal(loc=0., scale=1e5),    # beta
      tfd.HalfCauchy(loc=0., scale=5),  # sigma
      lambda s, b1, b0: tfd.MultivariateNormalDiag(  # y
          loc=affine(
            floor, b1[..., tf.newaxis], tf.gather(b0, county, axis=-1)),
          scale_identity_multiplier=s)
  ])


@tf.function
def unpooled_log_prob(beta0, beta1, sigma):
  """Computes `joint_log_prob` pinned at `log_radon`."""
  return (
    unpooled_model(floor, county).log_prob([beta0, beta1, sigma, log_radon]))
@tf.function
def sample_unpooled(num_chains, num_results, num_burnin_steps):
  """Samples from the unpooled model."""
  # Initialize the HMC transition kernel.
  hmc = tfp.mcmc.HamiltonianMonteCarlo(
      target_log_prob_fn=unpooled_log_prob,
      num_leapfrog_steps=10,
      step_size=0.025)

  initial_state = [
      tf.zeros([num_chains, num_counties], name='init_beta0'),
      tf.zeros([num_chains], name='init_beta1'),
      tf.ones([num_chains], name='init_sigma')
  ]
  # Contrain `sigma` to the positive real axis. Other variables are
  # unconstrained.
  unconstraining_bijectors = [
      tfb.Identity(),  # alpha
      tfb.Identity(),  # beta
      tfb.Exp()        # sigma
  ]
  kernel = tfp.mcmc.TransformedTransitionKernel(
      inner_kernel=hmc, bijector=unconstraining_bijectors)
  samples, kernel_results = tfp.mcmc.sample_chain(
      num_results=num_results,
      num_burnin_steps=num_burnin_steps,
      current_state=initial_state,
      kernel=kernel)

  acceptance_probs = tf.reduce_mean(
      tf.cast(kernel_results.inner_results.is_accepted, tf.float32), axis=0)

  return samples, acceptance_probs
UnpooledModel = collections.namedtuple('UnpooledModel',
                                       ['alpha', 'beta', 'sigma'])

samples, acceptance_probs = sample_unpooled(
    num_chains=4, num_results=1000, num_burnin_steps=1000)

print('Acceptance Probabilities: ', acceptance_probs.numpy())
unpooled_samples = UnpooledModel._make(samples)

print('R-hat for beta:',
      tfp.mcmc.potential_scale_reduction(unpooled_samples.beta).numpy())
print('R-hat for sigma:',
      tfp.mcmc.potential_scale_reduction(unpooled_samples.sigma).numpy())
Acceptance Probabilities:  [0.892 0.897 0.911 0.91 ]
R-hat for beta: 1.0079623
R-hat for sigma: 1.0059084
plot_traces(var_name='beta', samples=unpooled_samples.beta, num_chains=4)
plot_traces(var_name='sigma', samples=unpooled_samples.sigma, num_chains=4)


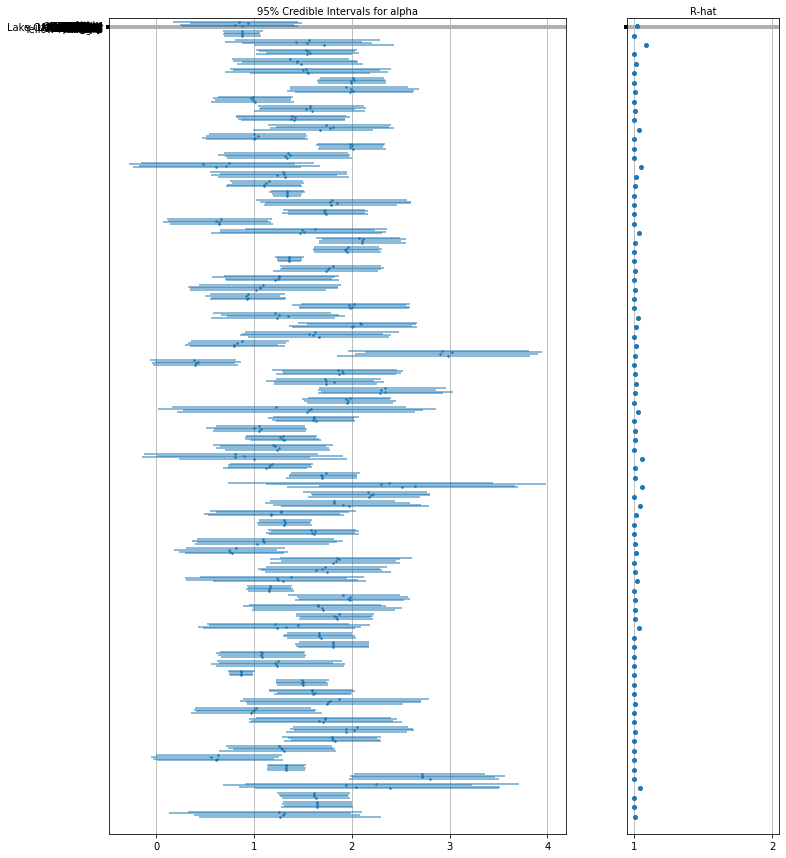
प्रत्येक श्रृंखला के लिए 95% विश्वसनीय अंतराल के साथ इंटरसेप्ट के लिए अनपूल किए गए काउंटी अपेक्षित मान यहां दिए गए हैं। हम प्रत्येक काउंटी के अनुमान के लिए आर-हैट मूल्य की भी रिपोर्ट करते हैं।
वन भूखंडों के लिए उपयोगिता कार्य।
def forest_plot(num_chains, num_vars, var_name, var_labels, samples):
  fig, axes = plt.subplots(
      1, 2, figsize=(12, 15), sharey=True, gridspec_kw={'width_ratios': [3, 1]})
  for var_idx in range(num_vars):
    values = samples[..., var_idx]
    rhat = tfp.mcmc.diagnostic.potential_scale_reduction(values).numpy()
    meds = np.median(values, axis=-2)
    los = np.percentile(values, 5, axis=-2)
    his = np.percentile(values, 95, axis=-2)

    for i in range(num_chains):
      height = 0.1 + 0.3 * var_idx + 0.05 * i
      axes[0].plot([los[i], his[i]], [height, height], 'C0-', lw=2, alpha=0.5)
      axes[0].plot([meds[i]], [height], 'C0o', ms=1.5)
    axes[1].plot([rhat], [height], 'C0o', ms=4)

  axes[0].set_yticks(np.linspace(0.2, 0.3, num_vars))
  axes[0].set_ylim(0, 26)
  axes[0].grid(which='both')
  axes[0].invert_yaxis()
  axes[0].set_yticklabels(var_labels)
  axes[0].xaxis.set_label_position('top')
  axes[0].set(xlabel='95% Credible Intervals for {}'.format(var_name))

  axes[1].set_xticks([1, 2])
  axes[1].set_xlim(0.95, 2.05)
  axes[1].grid(which='both')
  axes[1].set(xlabel='R-hat')
  axes[1].xaxis.set_label_position('top')

  plt.show()
forest_plot(
    num_chains=4,
    num_vars=num_counties,
    var_name='alpha',
    var_labels=county_name,
    samples=unpooled_samples.alpha.numpy())
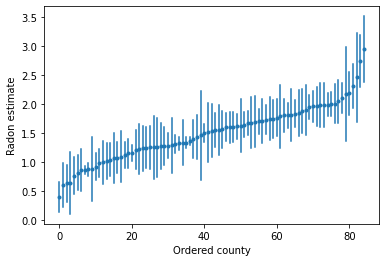
हम उच्च रेडॉन स्तरों वाले काउंटियों की पहचान करने के लिए क्रमबद्ध अनुमान लगा सकते हैं:
unpooled_intercepts = reduce_samples(unpooled_samples.alpha, np.mean)
unpooled_intercepts_se = reduce_samples(unpooled_samples.alpha, np.std)

def plot_ordered_estimates():
  means = pd.Series(unpooled_intercepts, index=county_name)
  std_errors = pd.Series(unpooled_intercepts_se, index=county_name)
  order = means.sort_values().index

  plt.plot(range(num_counties), means[order], '.')
  for i, m, se in zip(range(num_counties), means[order], std_errors[order]):
    plt.plot([i, i], [m - se, m + se], 'C0-')
  plt.xlabel('Ordered county')
  plt.ylabel('Radon estimate')
  plt.show()

plot_ordered_estimates()
काउंटियों के एक नमूना सेट के लिए अनुमान लगाने के लिए उपयोगिता कार्य।
def plot_estimates(linear_estimates, labels, sample_counties):
  fig, axes = plt.subplots(2, 4, figsize=(12, 6), sharey=True, sharex=True)
  axes = axes.ravel()
  intercepts_indexed = []
  slopes_indexed = []
  for intercepts, slopes in linear_estimates:
    intercepts_indexed.append(pd.Series(intercepts, index=county_name))
    slopes_indexed.append(pd.Series(slopes, index=county_name))

  markers = ['-', 'r--', 'k:']
  sample_county_codes = [county_name.index(c) for c in sample_counties]
  for i, c in enumerate(sample_county_codes):
    y = radon.log_radon[radon.county == c]
    x = radon.floor[radon.county == c]
    axes[i].scatter(
        x + np.random.randn(len(x)) * 0.01, y, alpha=0.4, label='Log Radon')

    # Plot both models and data
    xvals = np.linspace(-0.2, 1.2)
    for k in range(len(intercepts_indexed)):
      axes[i].plot(
          xvals,
          intercepts_indexed[k][c] + slopes_indexed[k][c] * xvals,
          markers[k],
          label=labels[k])

    axes[i].set_xticks([0, 1])
    axes[i].set_xticklabels(['Basement', 'First Floor'])
    axes[i].set_ylim(-1, 3)
    axes[i].set_title(sample_counties[i])
    if not i % 2:
      axes[i].set_ylabel('Log Radon level')
  axes[3].legend(bbox_to_anchor=(1.05, 0.9), borderaxespad=0.)

  plt.show()
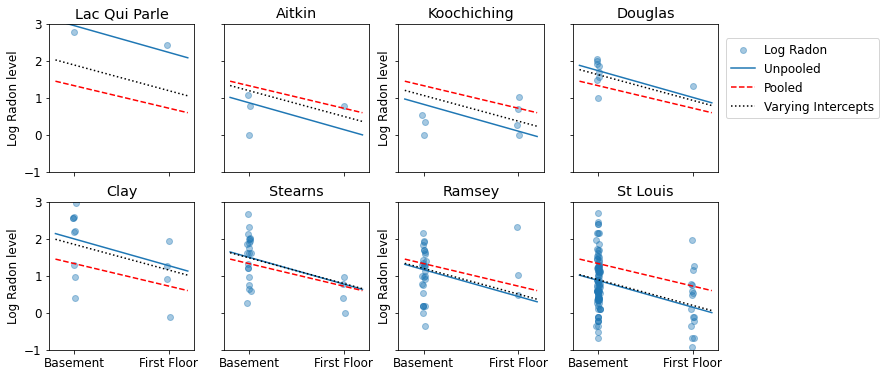
नमूना आकारों की एक श्रृंखला का प्रतिनिधित्व करने वाली काउंटियों के सबसेट के लिए पूल किए गए और अनपूल किए गए अनुमानों के बीच दृश्य तुलना यहां दी गई है।
unpooled_estimates = LinearEstimates(
  sample_mean(unpooled_samples.alpha),
  sample_mean(unpooled_samples.beta)
)

sample_counties = ('Lac Qui Parle', 'Aitkin', 'Koochiching', 'Douglas', 'Clay',
                   'Stearns', 'Ramsey', 'St Louis')
plot_estimates(
    linear_estimates=[unpooled_estimates, pooled_estimate],
    labels=['Unpooled Estimates', 'Pooled Estimates'],
    sample_counties=sample_counties)
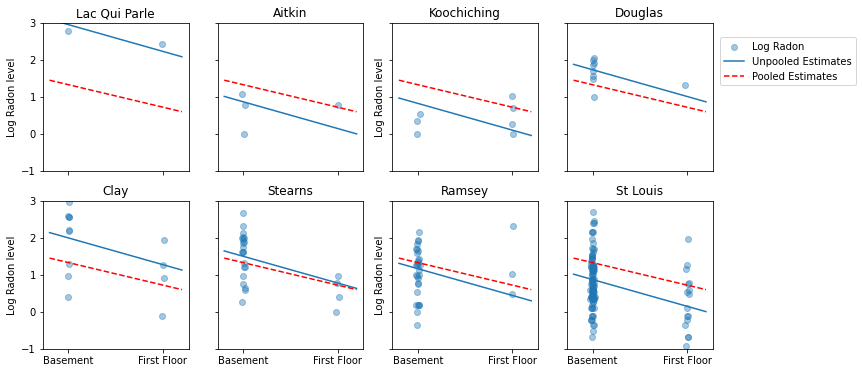
इनमें से कोई भी मॉडल संतोषजनक नहीं है:
- अगर हम हाई-रेडॉन काउंटियों की पहचान करने की कोशिश कर रहे हैं, तो पूलिंग उपयोगी नहीं है।
- हम कुछ अवलोकनों का उपयोग करके मॉडल द्वारा उत्पादित अत्यधिक अनपूल अनुमानों पर भरोसा नहीं करते हैं।
5 बहुस्तरीय और पदानुक्रमित मॉडल
जब हम अपने डेटा को पूल करते हैं, तो हम यह जानकारी खो देते हैं कि अलग-अलग देशों से अलग-अलग डेटा पॉइंट आए हैं। इसका मतलब है कि प्रत्येक radon स्तर के अवलोकन एक ही संभावना वितरण से नमूना है। ऐसा मॉडल नमूना इकाई में किसी भी भिन्नता को सीखने में विफल रहता है जो एक समूह (जैसे एक काउंटी) के भीतर निहित है। यह केवल नमूना विचरण के लिए जिम्मेदार है।
mpl.rc("font", size=18)

pgm = daft.PGM([13.6, 2.2], origin=[1.15, 1.0], node_ec="none")
pgm.add_node(daft.Node("parameter", r"parameter", 2.0, 3))
pgm.add_node(daft.Node("observations", r"observations", 2.0, 2))
pgm.add_node(daft.Node("theta", r"$\theta$", 5.5, 3))
pgm.add_node(daft.Node("y_0", r"$y_0$", 4, 2))
pgm.add_node(daft.Node("y_1", r"$y_1$", 5, 2))
pgm.add_node(daft.Node("dots", r"$\cdots$", 6, 2))
pgm.add_node(daft.Node("y_k", r"$y_k$", 7, 2))
pgm.add_edge("theta", "y_0")
pgm.add_edge("theta", "y_1")
pgm.add_edge("theta", "y_k")
pgm.render()
plt.show()

जब हम अनपूल किए गए डेटा का विश्लेषण करते हैं, तो हमारा मतलब है कि वे अलग-अलग मॉडलों से स्वतंत्र रूप से नमूने लिए गए हैं। पूल किए गए मामले से विपरीत चरम पर, यह दृष्टिकोण दावा करता है कि नमूना इकाइयों के बीच अंतर उन्हें संयोजित करने के लिए बहुत बड़ा है:
mpl.rc("font", size=18)

pgm = daft.PGM([13.6, 2.2], origin=[1.15, 1.0], node_ec="none")
pgm.add_node(daft.Node("parameter", r"parameter", 2.0, 3))
pgm.add_node(daft.Node("observations", r"observations", 2.0, 2))
pgm.add_node(daft.Node("theta_0", r"$\theta_0$", 4, 3))
pgm.add_node(daft.Node("theta_1", r"$\theta_1$", 5, 3))
pgm.add_node(daft.Node("theta_dots", r"$\cdots$", 6, 3))
pgm.add_node(daft.Node("theta_k", r"$\theta_k$", 7, 3))

pgm.add_node(daft.Node("y_0", r"$y_0$", 4, 2))
pgm.add_node(daft.Node("y_1", r"$y_1$", 5, 2))
pgm.add_node(daft.Node("y_dots", r"$\cdots$", 6, 2))
pgm.add_node(daft.Node("y_k", r"$y_k$", 7, 2))
pgm.add_edge("theta_0", "y_0")
pgm.add_edge("theta_1", "y_1")
pgm.add_edge("theta_k", "y_k")
pgm.render()
plt.show()

एक पदानुक्रमित मॉडल में, मापदंडों को मापदंडों के जनसंख्या वितरण से नमूने के रूप में देखा जाता है। इस प्रकार, हम उन्हें न तो पूरी तरह से अलग या बिल्कुल एक जैसे होने के रूप में देखते हैं। यह आंशिक पूलिंग के रूप में जाना जाता है।
mpl.rc("font", size=18)

pgm = daft.PGM([13.6, 3.4], origin=[1.15, 1.0], node_ec="none")
pgm.add_node(daft.Node("model", r"model", 2.0, 4))
pgm.add_node(daft.Node("parameter", r"parameter", 2.0, 3))
pgm.add_node(daft.Node("observations", r"observations", 2.0, 2))
pgm.add_node(daft.Node("mu_sigma", r"$\mu,\sigma^2$", 5.5, 4))
pgm.add_node(daft.Node("theta_0", r"$\theta_0$", 4, 3))
pgm.add_node(daft.Node("theta_1", r"$\theta_1$", 5, 3))
pgm.add_node(daft.Node("theta_dots", r"$\cdots$", 6, 3))
pgm.add_node(daft.Node("theta_k", r"$\theta_k$", 7, 3))
pgm.add_node(daft.Node("y_0", r"$y_0$", 4, 2))
pgm.add_node(daft.Node("y_1", r"$y_1$", 5, 2))
pgm.add_node(daft.Node("y_dots", r"$\cdots$", 6, 2))
pgm.add_node(daft.Node("y_k", r"$y_k$", 7, 2))
pgm.add_edge("mu_sigma", "theta_0")
pgm.add_edge("mu_sigma", "theta_1")
pgm.add_edge("mu_sigma", "theta_k")
pgm.add_edge("theta_0", "y_0")
pgm.add_edge("theta_1", "y_1")
pgm.add_edge("theta_k", "y_k")
pgm.render()
plt.show()

5.1 आंशिक पूलिंग
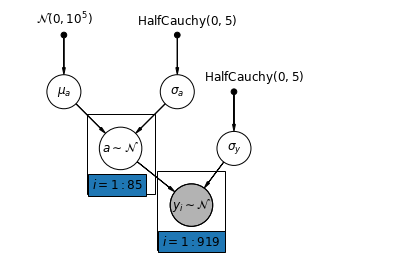
घरेलू रेडॉन डेटासेट के लिए सबसे सरल आंशिक पूलिंग मॉडल वह है जो समूह या व्यक्तिगत स्तर पर किसी भी भविष्यवक्ता के बिना, केवल रेडॉन स्तर का अनुमान लगाता है। व्यक्तिगत स्तर के भविष्यवक्ता का एक उदाहरण यह है कि क्या डेटा बिंदु बेसमेंट या पहली मंजिल से है। एक समूह-स्तरीय भविष्यवक्ता काउंटी-व्यापी माध्य यूरेनियम स्तर हो सकता है।
एक आंशिक पूलिंग मॉडल पूल किए गए और अनपूल किए गए चरम सीमाओं के बीच एक समझौता का प्रतिनिधित्व करता है, लगभग अनपूल किए गए काउंटी अनुमानों और पूल किए गए अनुमानों का भारित औसत (नमूना आकार के आधार पर)।
चलो \(\hat{\alpha}_j\) काउंटी में अनुमानित लॉग-राडोण स्तर होना \(j\)। यह सिर्फ एक अवरोधन है; हम अभी के लिए ढलानों की उपेक्षा करते हैं। \(n_j\) काउंटी से टिप्पणियों की संख्या है \(j\)। \(\sigma_{\alpha}\) और \(\sigma_y\) पैरामीटर के भीतर विचरण और विचरण क्रमशः नमूने हैं। तब एक आंशिक पूलिंग मॉडल प्रस्तुत कर सकता है:
\[\hat{\alpha}_j \approx \frac{(n_j/\sigma_y^2)\bar{y}_j + (1/\sigma_{\alpha}^2)\bar{y} }{(n_j/\sigma_y^2) + (1/\sigma_{\alpha}^2)}\]
आंशिक पूलिंग का उपयोग करते समय हम निम्नलिखित की अपेक्षा करते हैं:
- छोटे नमूना आकार वाले काउंटियों के अनुमान राज्य-व्यापी औसत की ओर कम हो जाएंगे।
- बड़े नमूना आकार वाले काउंटियों के अनुमान अनपूल किए गए काउंटी अनुमानों के करीब होंगे।
mpl.rc("font", size=12)
pgm = daft.PGM([7, 4.5], node_unit=1.2)
pgm.add_node(
    daft.Node(
        "mu_a_prior",
        r"$\mathcal{N}(0, 10^5)$",
        1,
        4,
        fixed=True,
        offset=(0, 5)))
pgm.add_node(
    daft.Node(
        "sigma_a_prior",
        r"$\mathrm{HalfCauchy}(0, 5)$",
        3,
        4,
        fixed=True,
        offset=(10, 5)))
pgm.add_node(
    daft.Node(
        "sigma_prior",
        r"$\mathrm{HalfCauchy}(0, 5)$",
        4,
        3,
        fixed=True,
        offset=(20, 5)))
pgm.add_node(daft.Node("mu_a", r"$\mu_a$", 1, 3))
pgm.add_node(daft.Node("sigma_a", r"$\sigma_a$", 3, 3))
pgm.add_node(daft.Node("a", r"$a \sim \mathcal{N}$", 2, 2, scale=1.25))
pgm.add_node(daft.Node("sigma_y", r"$\sigma_y$", 4, 2))
pgm.add_node(
    daft.Node(
        "y_i", r"$y_i \sim \mathcal{N}$", 3.25, 1, scale=1.25, observed=True))
pgm.add_edge("mu_a_prior", "mu_a")
pgm.add_edge("sigma_a_prior", "sigma_a")
pgm.add_edge("mu_a", "a")
pgm.add_edge("sigma_a", "a")
pgm.add_edge("sigma_prior", "sigma_y")
pgm.add_edge("sigma_y", "y_i")
pgm.add_edge("a", "y_i")
pgm.add_plate(daft.Plate([1.4, 1.2, 1.2, 1.4], "$i = 1:85$"))
pgm.add_plate(daft.Plate([2.65, 0.2, 1.2, 1.4], "$i = 1:919$"))

pgm.render()
plt.show()
def partial_pooling_model(county):
  """Creates a joint distribution for the partial pooling model."""
  return tfd.JointDistributionSequential([
      tfd.Normal(loc=0., scale=1e5),    # mu_a
      tfd.HalfCauchy(loc=0., scale=5),  # sigma_a
      lambda sigma_a, mu_a: tfd.MultivariateNormalDiag(  # a
          loc=mu_a[..., tf.newaxis] * tf.ones([num_counties])[tf.newaxis, ...],
          scale_identity_multiplier=sigma_a),
      tfd.HalfCauchy(loc=0., scale=5),  # sigma_y
      lambda sigma_y, a: tfd.MultivariateNormalDiag(  # y
          loc=tf.gather(a, county, axis=-1),
          scale_identity_multiplier=sigma_y)
  ])


@tf.function
def partial_pooling_log_prob(mu_a, sigma_a, a, sigma_y):
  """Computes joint log prob pinned at `log_radon`."""
  return partial_pooling_model(county).log_prob(
      [mu_a, sigma_a, a, sigma_y, log_radon])
@tf.function
def sample_partial_pooling(num_chains, num_results, num_burnin_steps):
  """Samples from the partial pooling model."""
  hmc = tfp.mcmc.HamiltonianMonteCarlo(
      target_log_prob_fn=partial_pooling_log_prob,
      num_leapfrog_steps=10,
      step_size=0.01)

  initial_state = [
      tf.zeros([num_chains], name='init_mu_a'),
      tf.ones([num_chains], name='init_sigma_a'),
      tf.zeros([num_chains, num_counties], name='init_a'),
      tf.ones([num_chains], name='init_sigma_y')
  ]
  unconstraining_bijectors = [
      tfb.Identity(),  # mu_a
      tfb.Exp(),       # sigma_a
      tfb.Identity(),  # a
      tfb.Exp()        # sigma_y
  ]
  kernel = tfp.mcmc.TransformedTransitionKernel(
      inner_kernel=hmc, bijector=unconstraining_bijectors)
  samples, kernel_results = tfp.mcmc.sample_chain(
      num_results=num_results,
      num_burnin_steps=num_burnin_steps,
      current_state=initial_state,
      kernel=kernel)

  acceptance_probs = tf.reduce_mean(
      tf.cast(kernel_results.inner_results.is_accepted, tf.float32), axis=0)

  return samples, acceptance_probs
PartialPoolingModel = collections.namedtuple(
    'PartialPoolingModel', ['mu_a', 'sigma_a', 'a', 'sigma_y'])

samples, acceptance_probs = sample_partial_pooling(
    num_chains=4, num_results=1000, num_burnin_steps=1000)

print('Acceptance Probabilities: ', acceptance_probs.numpy())
partial_pooling_samples = PartialPoolingModel._make(samples)
Acceptance Probabilities: [0.989 0.977 0.988 0.985]
for var in ['mu_a', 'sigma_a', 'sigma_y']:
  print(
      'R-hat for ', var, '\t:',
      tfp.mcmc.potential_scale_reduction(getattr(partial_pooling_samples,
                                                 var)).numpy())
R-hat for  mu_a     : 1.0216417
R-hat for  sigma_a  : 1.0224565
R-hat for  sigma_y  : 1.0016255
partial_pooling_intercepts = reduce_samples(
    partial_pooling_samples.a.numpy(), np.mean)
partial_pooling_intercepts_se = reduce_samples(
    partial_pooling_samples.a.numpy(), np.std)

def plot_unpooled_vs_partial_pooling_estimates():
  fig, axes = plt.subplots(1, 2, figsize=(14, 6), sharex=True, sharey=True)

  # Order counties by number of observations (and add some jitter).
  num_obs_per_county = (
      radon.groupby('county')['idnum'].count().values.astype(np.float32))
  num_obs_per_county += np.random.normal(scale=0.5, size=num_counties)

  intercepts_list = [unpooled_intercepts, partial_pooling_intercepts]
  intercepts_se_list = [unpooled_intercepts_se, partial_pooling_intercepts_se]

  for ax, means, std_errors in zip(axes, intercepts_list, intercepts_se_list):
    ax.plot(num_obs_per_county, means, 'C0.')
    for n, m, se in zip(num_obs_per_county, means, std_errors):
      ax.plot([n, n], [m - se, m + se], 'C1-', alpha=.5)

  for ax in axes:
    ax.set_xscale('log')
    ax.set_xlabel('No. of Observations Per County')
    ax.set_xlim(1, 100)
    ax.set_ylabel('Log Radon Estimate (with Standard Error)')
    ax.set_ylim(0, 3)
    ax.hlines(partial_pooling_intercepts.mean(), .9, 125, 'k', '--', alpha=.5)
  axes[0].set_title('Unpooled Estimates')
  axes[1].set_title('Partially Pooled Estimates')

plot_unpooled_vs_partial_pooling_estimates()
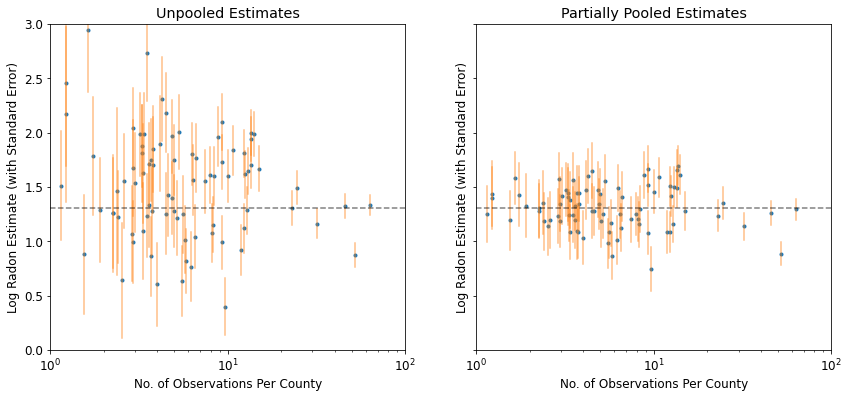
विशेष रूप से छोटे नमूना आकारों पर अनपूल किए गए और आंशिक रूप से पूल किए गए अनुमानों के बीच अंतर पर ध्यान दें। पूर्व दोनों अधिक चरम और अधिक सटीक हैं।
5.2 भिन्न अवरोधन
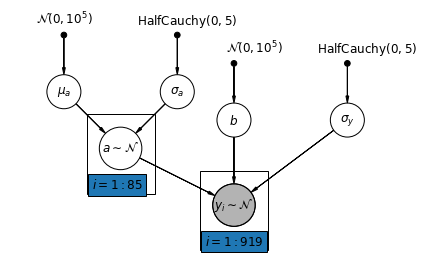
अब हम एक अधिक जटिल मॉडल पर विचार करते हैं जो यादृच्छिक प्रभाव के अनुसार, पूरे देश में इंटरसेप्ट को अलग-अलग करने की अनुमति देता है।
\(y_i = \alpha_{j[i]} + \beta x_{i} + \epsilon_i\) जहां\(\epsilon_i \sim N(0, \sigma_y^2)\) और अवरोधन यादृच्छिक प्रभाव:
\[\alpha_{j[i]} \sim N(\mu_{\alpha}, \sigma_{\alpha}^2)\]
ढलान \(\beta\), जो अवलोकन माप (तहखाने या पहली मंजिल) के स्थान के अनुसार अलग-अलग हो सकते हैं, अभी भी एक निश्चित प्रभाव विभिन्न काउंटियों के बीच साझा किया है।
Unpooling मॉडल के साथ के रूप में, हम प्रत्येक काउंटी के लिए एक अलग अवरोधन सेट, बल्कि प्रत्येक काउंटी, काउंटियों में बहुस्तरीय मॉडलिंग शेयरों शक्ति के लिए अलग से कम से कम वर्गों प्रतिगमन मॉडल फिटिंग, कम डेटा वाली काउंटियों में अधिक उचित निष्कर्ष के लिए अनुमति देता है।
mpl.rc("font", size=12)
pgm = daft.PGM([7, 4.5], node_unit=1.2)
pgm.add_node(
    daft.Node(
        "mu_a_prior",
        r"$\mathcal{N}(0, 10^5)$",
        1,
        4,
        fixed=True,
        offset=(0, 5)))
pgm.add_node(
    daft.Node(
        "sigma_a_prior",
        r"$\mathrm{HalfCauchy}(0, 5)$",
        3,
        4,
        fixed=True,
        offset=(10, 5)))
pgm.add_node(
    daft.Node(
        "b_prior",
        r"$\mathcal{N}(0, 10^5)$",
        4,
        3.5,
        fixed=True,
        offset=(20, 5)))
pgm.add_node(daft.Node("b", r"$b$", 4, 2.5))
pgm.add_node(
    daft.Node(
        "sigma_prior",
        r"$\mathrm{HalfCauchy}(0, 5)$",
        6,
        3.5,
        fixed=True,
        offset=(20, 5)))
pgm.add_node(daft.Node("mu_a", r"$\mu_a$", 1, 3))
pgm.add_node(daft.Node("sigma_a", r"$\sigma_a$", 3, 3))
pgm.add_node(daft.Node("a", r"$a \sim \mathcal{N}$", 2, 2, scale=1.25))
pgm.add_node(daft.Node("sigma_y", r"$\sigma_y$", 6, 2.5))
pgm.add_node(
    daft.Node(
        "y_i", r"$y_i \sim \mathcal{N}$", 4, 1, scale=1.25, observed=True))
pgm.add_edge("mu_a_prior", "mu_a")
pgm.add_edge("sigma_a_prior", "sigma_a")
pgm.add_edge("mu_a", "a")
pgm.add_edge("b_prior", "b")
pgm.add_edge("sigma_a", "a")
pgm.add_edge("sigma_prior", "sigma_y")
pgm.add_edge("sigma_y", "y_i")
pgm.add_edge("a", "y_i")
pgm.add_edge("b", "y_i")
pgm.add_plate(daft.Plate([1.4, 1.2, 1.2, 1.4], "$i = 1:85$"))
pgm.add_plate(daft.Plate([3.4, 0.2, 1.2, 1.4], "$i = 1:919$"))

pgm.render()
plt.show()
def varying_intercept_model(floor, county):
  """Creates a joint distribution for the varying intercept model."""
  return tfd.JointDistributionSequential([
      tfd.Normal(loc=0., scale=1e5),    # mu_a
      tfd.HalfCauchy(loc=0., scale=5),  # sigma_a
      lambda sigma_a, mu_a: tfd.MultivariateNormalDiag(  # a
          loc=affine(tf.ones([num_counties]), mu_a[..., tf.newaxis]),
          scale_identity_multiplier=sigma_a),
      tfd.Normal(loc=0., scale=1e5),    # b
      tfd.HalfCauchy(loc=0., scale=5),  # sigma_y
      lambda sigma_y, b, a: tfd.MultivariateNormalDiag(  # y
          loc=affine(floor, b[..., tf.newaxis], tf.gather(a, county, axis=-1)),
          scale_identity_multiplier=sigma_y)
  ])


def varying_intercept_log_prob(mu_a, sigma_a, a, b, sigma_y):
  """Computes joint log prob pinned at `log_radon`."""
  return varying_intercept_model(floor, county).log_prob(
      [mu_a, sigma_a, a, b, sigma_y, log_radon])
@tf.function
def sample_varying_intercepts(num_chains, num_results, num_burnin_steps):
  """Samples from the varying intercepts model."""
  hmc = tfp.mcmc.HamiltonianMonteCarlo(
      target_log_prob_fn=varying_intercept_log_prob,
      num_leapfrog_steps=10,
      step_size=0.01)

  initial_state = [
      tf.zeros([num_chains], name='init_mu_a'),
      tf.ones([num_chains], name='init_sigma_a'),
      tf.zeros([num_chains, num_counties], name='init_a'),
      tf.zeros([num_chains], name='init_b'),
      tf.ones([num_chains], name='init_sigma_y')
  ]
  unconstraining_bijectors = [
      tfb.Identity(),  # mu_a
      tfb.Exp(),       # sigma_a
      tfb.Identity(),  # a
      tfb.Identity(),  # b
      tfb.Exp()        # sigma_y
  ]
  kernel = tfp.mcmc.TransformedTransitionKernel(
      inner_kernel=hmc, bijector=unconstraining_bijectors)
  samples, kernel_results = tfp.mcmc.sample_chain(
      num_results=num_results,
      num_burnin_steps=num_burnin_steps,
      current_state=initial_state,
      kernel=kernel)

  acceptance_probs = tf.reduce_mean(
      tf.cast(kernel_results.inner_results.is_accepted, tf.float32), axis=0)

  return samples, acceptance_probs
VaryingInterceptsModel = collections.namedtuple(
    'VaryingInterceptsModel', ['mu_a', 'sigma_a', 'a', 'b', 'sigma_y'])

samples, acceptance_probs = sample_varying_intercepts(
    num_chains=4, num_results=1000, num_burnin_steps=1000)

print('Acceptance Probabilities: ', acceptance_probs.numpy())
varying_intercepts_samples = VaryingInterceptsModel._make(samples)
Acceptance Probabilities: [0.978 0.987 0.982 0.984]
for var in ['mu_a', 'sigma_a', 'b', 'sigma_y']:
  print(
      'R-hat for ', var, ': ',
      tfp.mcmc.potential_scale_reduction(
          getattr(varying_intercepts_samples, var)).numpy())
R-hat for  mu_a :  1.1099764
R-hat for  sigma_a :  1.1058794
R-hat for  b :  1.0448593
R-hat for  sigma_y :  1.0019052
varying_intercepts_estimates = LinearEstimates(
    sample_mean(varying_intercepts_samples.a),
    sample_mean(varying_intercepts_samples.b))
sample_counties = ('Lac Qui Parle', 'Aitkin', 'Koochiching', 'Douglas', 'Clay',
                   'Stearns', 'Ramsey', 'St Louis')
plot_estimates(
    linear_estimates=[
        unpooled_estimates, pooled_estimate, varying_intercepts_estimates
    ],
    labels=['Unpooled', 'Pooled', 'Varying Intercepts'],
    sample_counties=sample_counties)
def plot_posterior(var_name, var_samples):
  if isinstance(var_samples, tf.Tensor):
    var_samples = var_samples.numpy() # convert to numpy array

  fig = plt.figure(figsize=(10, 3))
  ax = fig.add_subplot(111)
  ax.hist(var_samples.flatten(), bins=40, edgecolor='white')
  sample_mean = var_samples.mean()
  ax.text(
      sample_mean,
      100,
      'mean={:.3f}'.format(sample_mean),
      color='white',
      fontsize=12)
  ax.set_xlabel('posterior of ' + var_name)
  plt.show()


plot_posterior('b', varying_intercepts_samples.b)
plot_posterior('sigma_a', varying_intercepts_samples.sigma_a)
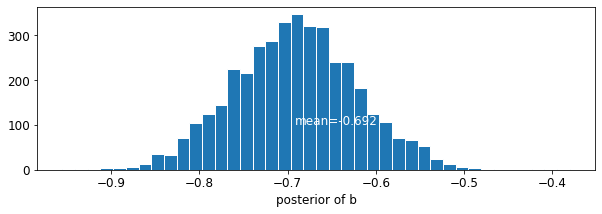
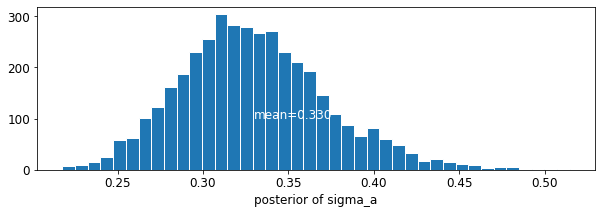
मंजिल गुणांक के लिए अनुमान लगभग -0.69 है, जो लगभग आधे (होने बेसमेंट बिना घरों के रूप में व्याख्या की जा सकती है\(\exp(-0.69) = 0.50\),) बेसमेंट के साथ उन लोगों के राडोण स्तरों काउंटी के लिए लेखांकन के बाद।
for var in ['b']:
  var_samples = getattr(varying_intercepts_samples, var)
  mean = var_samples.numpy().mean()
  std = var_samples.numpy().std()
  r_hat = tfp.mcmc.potential_scale_reduction(var_samples).numpy()
  n_eff = tfp.mcmc.effective_sample_size(var_samples).numpy().sum()

  print('var: ', var, ' mean: ', mean, ' std: ', std, ' n_eff: ', n_eff,
        ' r_hat: ', r_hat)
var: b mean: -0.6972574 std: 0.06966117 n_eff: 397.94327 r_hat: 1.0448593
def plot_intercepts_and_slopes(linear_estimates, title):
  xvals = np.arange(2)
  intercepts = np.ones([num_counties]) * linear_estimates.intercept
  slopes = np.ones([num_counties]) * linear_estimates.slope
  fig, ax = plt.subplots()
  for c in range(num_counties):
    ax.plot(xvals, intercepts[c] + slopes[c] * xvals, 'bo-', alpha=0.4)
  plt.xlim(-0.2, 1.2)
  ax.set_xticks([0, 1])
  ax.set_xticklabels(['Basement', 'First Floor'])
  ax.set_ylabel('Log Radon level')
  plt.title(title)
  plt.show()
plot_intercepts_and_slopes(varying_intercepts_estimates,
                           'Log Radon Estimates (Varying Intercepts)')
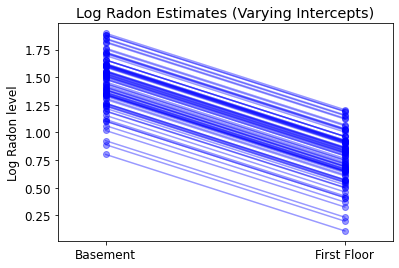
5.3 बदलती ढलानें
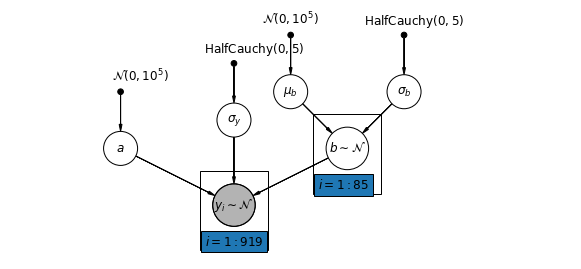
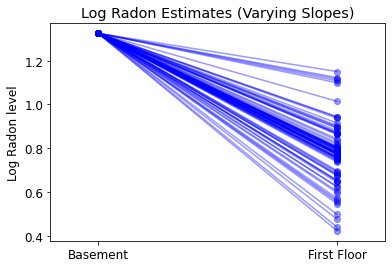
वैकल्पिक रूप से, हम एक मॉडल प्रस्तुत कर सकते हैं जो काउंटियों को माप के स्थान (तहखाने या पहली मंजिल) के अनुसार रेडॉन रीडिंग को प्रभावित करने की अनुमति देता है। इस मामले में अवरोधन \(\alpha\) काउंटियों के बीच साझा किया जाता है।
\[y_i = \alpha + \beta_{j[i]} x_{i} + \epsilon_i\]
mpl.rc("font", size=12)
pgm = daft.PGM([10, 4.5], node_unit=1.2)
pgm.add_node(
    daft.Node(
        "mu_b_prior",
        r"$\mathcal{N}(0, 10^5)$",
        3.2,
        4,
        fixed=True,
        offset=(0, 5)))
pgm.add_node(
    daft.Node(
        "a_prior", r"$\mathcal{N}(0, 10^5)$", 2, 3, fixed=True, offset=(20, 5)))
pgm.add_node(daft.Node("a", r"$a$", 2, 2))

pgm.add_node(
    daft.Node(
        "sigma_prior",
        r"$\mathrm{HalfCauchy}(0, 5)$",
        4,
        3.5,
        fixed=True,
        offset=(20, 5)))
pgm.add_node(daft.Node("sigma_y", r"$\sigma_y$", 4, 2.5))

pgm.add_node(
    daft.Node(
        "mu_b_prior",
        r"$\mathcal{N}(0, 10^5)$",
        5,
        4,
        fixed=True,
        offset=(0, 5)))
pgm.add_node(
    daft.Node(
        "sigma_b_prior",
        r"$\mathrm{HalfCauchy}(0, 5)$",
        7,
        4,
        fixed=True,
        offset=(10, 5)))
pgm.add_node(daft.Node("mu_b", r"$\mu_b$", 5, 3))
pgm.add_node(daft.Node("sigma_b", r"$\sigma_b$", 7, 3))
pgm.add_node(daft.Node("b", r"$b \sim \mathcal{N}$", 6, 2, scale=1.25))

pgm.add_node(
    daft.Node(
        "y_i", r"$y_i \sim \mathcal{N}$", 4, 1, scale=1.25, observed=True))
pgm.add_edge("a_prior", "a")

pgm.add_edge("mu_b_prior", "mu_b")
pgm.add_edge("sigma_b_prior", "sigma_b")
pgm.add_edge("mu_b", "b")
pgm.add_edge("sigma_b", "b")

pgm.add_edge("sigma_prior", "sigma_y")

pgm.add_edge("sigma_y", "y_i")
pgm.add_edge("a", "y_i")
pgm.add_edge("b", "y_i")
pgm.add_plate(daft.Plate([5.4, 1.2, 1.2, 1.4], "$i = 1:85$"))
pgm.add_plate(daft.Plate([3.4, 0.2, 1.2, 1.4], "$i = 1:919$"))

pgm.render()
plt.show()
def varying_slopes_model(floor, county):
  """Creates a joint distribution for the varying slopes model."""
  return tfd.JointDistributionSequential([
      tfd.Normal(loc=0., scale=1e5),  # mu_b
      tfd.HalfCauchy(loc=0., scale=5),  # sigma_b
      tfd.Normal(loc=0., scale=1e5),  # a
      lambda _, sigma_b, mu_b: tfd.MultivariateNormalDiag(  # b
          loc=affine(tf.ones([num_counties]), mu_b[..., tf.newaxis]),
          scale_identity_multiplier=sigma_b),
      tfd.HalfCauchy(loc=0., scale=5),  # sigma_y
      lambda sigma_y, b, a: tfd.MultivariateNormalDiag(  # y
          loc=affine(floor, tf.gather(b, county, axis=-1), a[..., tf.newaxis]),
          scale_identity_multiplier=sigma_y)
  ])


def varying_slopes_log_prob(mu_b, sigma_b, a, b, sigma_y):
  return varying_slopes_model(floor, county).log_prob(
      [mu_b, sigma_b, a, b, sigma_y, log_radon])
@tf.function
def sample_varying_slopes(num_chains, num_results, num_burnin_steps):
  """Samples from the varying slopes model."""
  hmc = tfp.mcmc.HamiltonianMonteCarlo(
      target_log_prob_fn=varying_slopes_log_prob,
      num_leapfrog_steps=25,
      step_size=0.01)

  initial_state = [
      tf.zeros([num_chains], name='init_mu_b'),
      tf.ones([num_chains], name='init_sigma_b'),
      tf.zeros([num_chains], name='init_a'),
      tf.zeros([num_chains, num_counties], name='init_b'),
      tf.ones([num_chains], name='init_sigma_y')
  ]
  unconstraining_bijectors = [
      tfb.Identity(),  # mu_b
      tfb.Exp(),       # sigma_b
      tfb.Identity(),  # a
      tfb.Identity(),  # b
      tfb.Exp()        # sigma_y
  ]
  kernel = tfp.mcmc.TransformedTransitionKernel(
      inner_kernel=hmc, bijector=unconstraining_bijectors)
  samples, kernel_results = tfp.mcmc.sample_chain(
      num_results=num_results,
      num_burnin_steps=num_burnin_steps,
      current_state=initial_state,
      kernel=kernel)

  acceptance_probs = tf.reduce_mean(
      tf.cast(kernel_results.inner_results.is_accepted, tf.float32), axis=0)

  return samples, acceptance_probs
VaryingSlopesModel = collections.namedtuple(
    'VaryingSlopesModel', ['mu_b', 'sigma_b', 'a', 'b', 'sigma_y'])

samples, acceptance_probs = sample_varying_slopes(
    num_chains=4, num_results=1000, num_burnin_steps=1000)

print('Acceptance Probabilities: ', acceptance_probs.numpy())
varying_slopes_samples = VaryingSlopesModel._make(samples)
Acceptance Probabilities: [0.979 0.984 0.977 0.984]
for var in ['mu_b', 'sigma_b', 'a', 'sigma_y']:
  print(
      'R-hat for ', var, '\t: ',
      tfp.mcmc.potential_scale_reduction(getattr(varying_slopes_samples,
                                                 var)).numpy())
R-hat for  mu_b     :  1.0770341
R-hat for  sigma_b  :  1.0634488
R-hat for  a    :  1.0133665
R-hat for  sigma_y  :  1.0011941
varying_slopes_estimates = LinearEstimates(
    sample_mean(varying_slopes_samples.a),
    sample_mean(varying_slopes_samples.b))

plot_intercepts_and_slopes(varying_slopes_estimates,
                           'Log Radon Estimates (Varying Slopes)')
5.4 अलग-अलग अवरोधन और ढलान
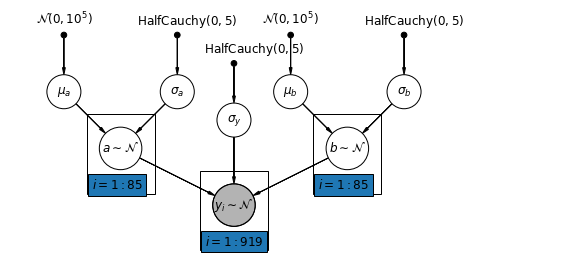
सबसे सामान्य मॉडल काउंटी द्वारा इंटरसेप्ट और ढलान दोनों को अलग-अलग करने की अनुमति देता है:
\[y_i = \alpha_{j[i]} + \beta_{j[i]} x_{i} + \epsilon_i\]
mpl.rc("font", size=12)
pgm = daft.PGM([10, 4.5], node_unit=1.2)
pgm.add_node(
    daft.Node(
        "mu_a_prior",
        r"$\mathcal{N}(0, 10^5)$",
        1,
        4,
        fixed=True,
        offset=(0, 5)))
pgm.add_node(
    daft.Node(
        "sigma_a_prior",
        r"$\mathrm{HalfCauchy}(0, 5)$",
        3,
        4,
        fixed=True,
        offset=(10, 5)))
pgm.add_node(daft.Node("mu_a", r"$\mu_a$", 1, 3))
pgm.add_node(daft.Node("sigma_a", r"$\sigma_a$", 3, 3))
pgm.add_node(daft.Node("a", r"$a \sim \mathcal{N}$", 2, 2, scale=1.25))

pgm.add_node(
    daft.Node(
        "sigma_prior",
        r"$\mathrm{HalfCauchy}(0, 5)$",
        4,
        3.5,
        fixed=True,
        offset=(20, 5)))
pgm.add_node(daft.Node("sigma_y", r"$\sigma_y$", 4, 2.5))

pgm.add_node(
    daft.Node(
        "mu_b_prior",
        r"$\mathcal{N}(0, 10^5)$",
        5,
        4,
        fixed=True,
        offset=(0, 5)))
pgm.add_node(
    daft.Node(
        "sigma_b_prior",
        r"$\mathrm{HalfCauchy}(0, 5)$",
        7,
        4,
        fixed=True,
        offset=(10, 5)))
pgm.add_node(daft.Node("mu_b", r"$\mu_b$", 5, 3))
pgm.add_node(daft.Node("sigma_b", r"$\sigma_b$", 7, 3))
pgm.add_node(daft.Node("b", r"$b \sim \mathcal{N}$", 6, 2, scale=1.25))

pgm.add_node(
    daft.Node(
        "y_i", r"$y_i \sim \mathcal{N}$", 4, 1, scale=1.25, observed=True))
pgm.add_edge("mu_a_prior", "mu_a")
pgm.add_edge("sigma_a_prior", "sigma_a")
pgm.add_edge("mu_a", "a")
pgm.add_edge("sigma_a", "a")

pgm.add_edge("mu_b_prior", "mu_b")
pgm.add_edge("sigma_b_prior", "sigma_b")
pgm.add_edge("mu_b", "b")
pgm.add_edge("sigma_b", "b")

pgm.add_edge("sigma_prior", "sigma_y")

pgm.add_edge("sigma_y", "y_i")
pgm.add_edge("a", "y_i")
pgm.add_edge("b", "y_i")
pgm.add_plate(daft.Plate([1.4, 1.2, 1.2, 1.4], "$i = 1:85$"))
pgm.add_plate(daft.Plate([5.4, 1.2, 1.2, 1.4], "$i = 1:85$"))
pgm.add_plate(daft.Plate([3.4, 0.2, 1.2, 1.4], "$i = 1:919$"))

pgm.render()
plt.show()
def varying_intercepts_and_slopes_model(floor, county):
  """Creates a joint distribution for the varying slope model."""
  return tfd.JointDistributionSequential([
      tfd.Normal(loc=0., scale=1e5),    # mu_a
      tfd.HalfCauchy(loc=0., scale=5),  # sigma_a
      tfd.Normal(loc=0., scale=1e5),    # mu_b
      tfd.HalfCauchy(loc=0., scale=5),  # sigma_b
      lambda sigma_b, mu_b, sigma_a, mu_a: tfd.MultivariateNormalDiag(  # a
          loc=affine(tf.ones([num_counties]), mu_a[..., tf.newaxis]),
          scale_identity_multiplier=sigma_a),
      lambda _, sigma_b, mu_b: tfd.MultivariateNormalDiag(  # b
          loc=affine(tf.ones([num_counties]), mu_b[..., tf.newaxis]),
          scale_identity_multiplier=sigma_b),
      tfd.HalfCauchy(loc=0., scale=5),  # sigma_y
      lambda sigma_y, b, a: tfd.MultivariateNormalDiag(  # y
          loc=affine(floor, tf.gather(b, county, axis=-1),
                     tf.gather(a, county, axis=-1)),
          scale_identity_multiplier=sigma_y)
  ])


@tf.function
def varying_intercepts_and_slopes_log_prob(mu_a, sigma_a, mu_b, sigma_b, a, b,
                                           sigma_y):
  """Computes joint log prob pinned at `log_radon`."""
  return varying_intercepts_and_slopes_model(floor, county).log_prob(
      [mu_a, sigma_a, mu_b, sigma_b, a, b, sigma_y, log_radon])
@tf.function
def sample_varying_intercepts_and_slopes(num_chains, num_results,
                                         num_burnin_steps):
  """Samples from the varying intercepts and slopes model."""
  hmc = tfp.mcmc.HamiltonianMonteCarlo(
      target_log_prob_fn=varying_intercepts_and_slopes_log_prob,
      num_leapfrog_steps=50,
      step_size=0.01)

  initial_state = [
      tf.zeros([num_chains], name='init_mu_a'),
      tf.ones([num_chains], name='init_sigma_a'),
      tf.zeros([num_chains], name='init_mu_b'),
      tf.ones([num_chains], name='init_sigma_b'),
      tf.zeros([num_chains, num_counties], name='init_a'),
      tf.zeros([num_chains, num_counties], name='init_b'),
      tf.ones([num_chains], name='init_sigma_y')
  ]
  unconstraining_bijectors = [
      tfb.Identity(),  # mu_a
      tfb.Exp(),       # sigma_a
      tfb.Identity(),  # mu_b
      tfb.Exp(),       # sigma_b
      tfb.Identity(),  # a
      tfb.Identity(),  # b
      tfb.Exp()        # sigma_y
  ]
  kernel = tfp.mcmc.TransformedTransitionKernel(
      inner_kernel=hmc, bijector=unconstraining_bijectors)
  samples, kernel_results = tfp.mcmc.sample_chain(
      num_results=num_results,
      num_burnin_steps=num_burnin_steps,
      current_state=initial_state,
      kernel=kernel)

  acceptance_probs = tf.reduce_mean(
      tf.cast(kernel_results.inner_results.is_accepted, tf.float32), axis=0)

  return samples, acceptance_probs
VaryingInterceptsAndSlopesModel = collections.namedtuple(
    'VaryingInterceptsAndSlopesModel',
    ['mu_a', 'sigma_a', 'mu_b', 'sigma_b', 'a', 'b', 'sigma_y'])

samples, acceptance_probs = sample_varying_intercepts_and_slopes(
    num_chains=4, num_results=1000, num_burnin_steps=500)

print('Acceptance Probabilities: ', acceptance_probs.numpy())
varying_intercepts_and_slopes_samples = VaryingInterceptsAndSlopesModel._make(
    samples)
Acceptance Probabilities: [0.988 0.985 0.992 0.938]
for var in ['mu_a', 'sigma_a', 'mu_b', 'sigma_b']:
  print(
      'R-hat for ', var, '\t: ',
      tfp.mcmc.potential_scale_reduction(
          getattr(varying_intercepts_and_slopes_samples, var)).numpy())
R-hat for  mu_a     :  1.010764
R-hat for  sigma_a  :  1.0078123
R-hat for  mu_b     :  1.0279609
R-hat for  sigma_b  :  1.3165458
varying_intercepts_and_slopes_estimates = LinearEstimates(
    sample_mean(varying_intercepts_and_slopes_samples.a),
    sample_mean(varying_intercepts_and_slopes_samples.b))

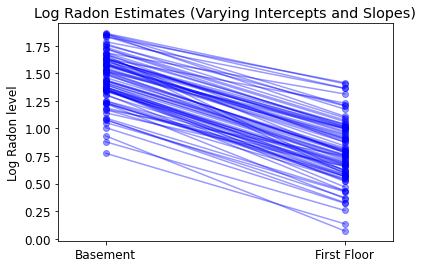
plot_intercepts_and_slopes(
    varying_intercepts_and_slopes_estimates,
    'Log Radon Estimates (Varying Intercepts and Slopes)')
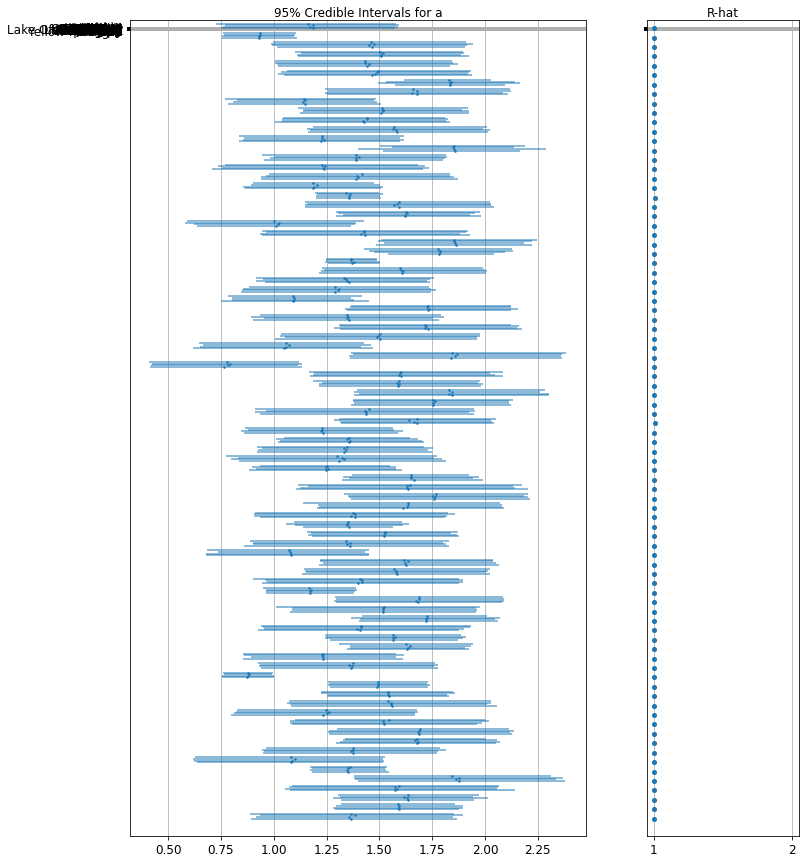
forest_plot(
    num_chains=4,
    num_vars=num_counties,
    var_name='a',
    var_labels=county_name,
    samples=varying_intercepts_and_slopes_samples.a.numpy())
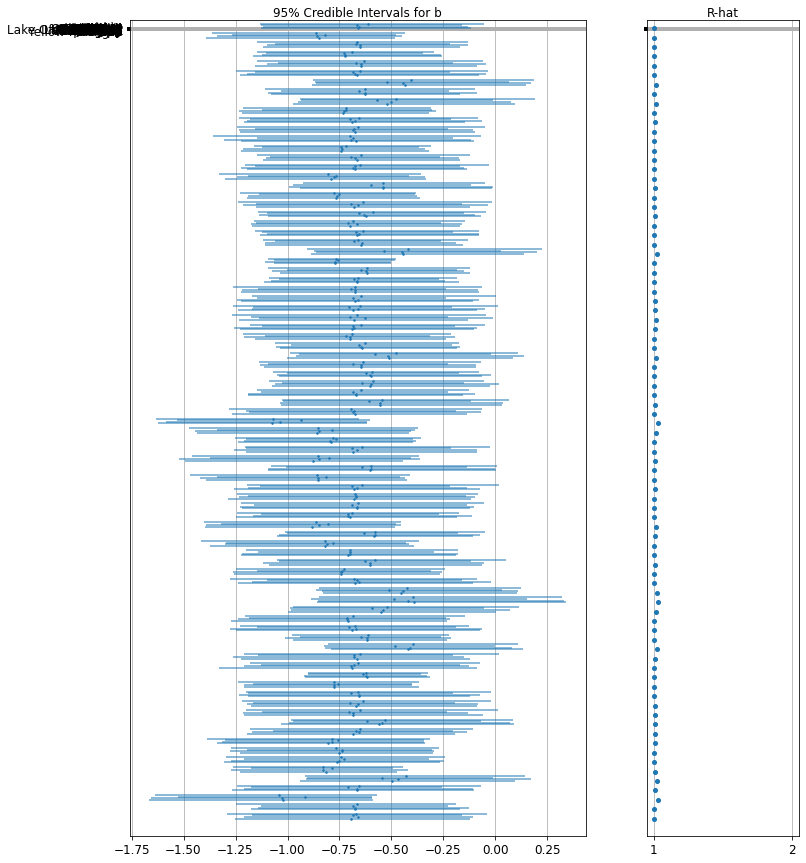
forest_plot(
    num_chains=4,
    num_vars=num_counties,
    var_name='b',
    var_labels=county_name,
    samples=varying_intercepts_and_slopes_samples.b.numpy())
6 समूह-स्तरीय भविष्यवक्ताओं को जोड़ना
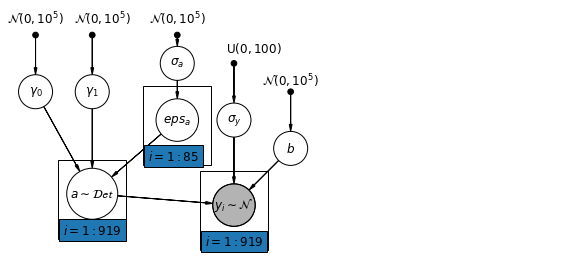
बहुस्तरीय मॉडल की एक प्राथमिक ताकत एक साथ कई स्तरों पर भविष्यवक्ताओं को संभालने की क्षमता है। यदि हम ऊपर दिए गए भिन्न-अवरोधन मॉडल पर विचार करते हैं:
\(y_i = \alpha_{j[i]} + \beta x_{i} + \epsilon_i\) हम, एक सरल यादृच्छिक प्रभाव के बजाय उम्मीद राडोण मूल्य में परिवर्तन का वर्णन करने के कर सकते हैं, एक काउंटी स्तरीय covariate के साथ एक और प्रतिगमन मॉडल निर्दिष्ट करें। यहाँ, हम काउंटी यूरेनियम पढ़ने का उपयोग \(u_j\), जो राडोण स्तर से संबंधित माना जाता है:
\(\alpha_j = \gamma_0 + \gamma_1 u_j + \zeta_j\)\(\zeta_j \sim N(0, \sigma_{\alpha}^2)\) इस प्रकार, हम अब एक घर स्तरीय भविष्यवक्ता (फर्श या तहखाने) और साथ ही एक काउंटी स्तरीय भविष्यवक्ता (यूरेनियम) को शामिल कर रहे हैं।
ध्यान दें कि मॉडल में प्रत्येक काउंटी के लिए दोनों संकेतक चर हैं, साथ ही एक काउंटी-स्तरीय कोवरिएट भी है। शास्त्रीय प्रतिगमन में, इसका परिणाम संपार्श्विकता में होगा। एक बहुस्तरीय मॉडल में, समूह-स्तरीय रैखिक मॉडल के अपेक्षित मूल्य की ओर इंटरसेप्ट का आंशिक पूलिंग इससे बचा जाता है।
समूह-स्तरीय भविष्यवक्ताओं भी समूह-स्तरीय भिन्नता को कम करने की सेवा\(\sigma_{\alpha}\)। इसका एक महत्वपूर्ण निहितार्थ यह है कि समूह-स्तरीय अनुमान मजबूत पूलिंग को प्रेरित करता है।
6.1 पदानुक्रमित अवरोधन मॉडल
mpl.rc("font", size=12)
pgm = daft.PGM([10, 4.5], node_unit=1.2)
pgm.add_node(
    daft.Node(
        "gamma_0_prior",
        r"$\mathcal{N}(0, 10^5)$",
        0.5,
        4,
        fixed=True,
        offset=(0, 5)))
pgm.add_node(
    daft.Node(
        "gamma_1_prior",
        r"$\mathcal{N}(0, 10^5)$",
        1.5,
        4,
        fixed=True,
        offset=(10, 5)))
pgm.add_node(daft.Node("gamma_0", r"$\gamma_0$", 0.5, 3))
pgm.add_node(daft.Node("gamma_1", r"$\gamma_1$", 1.5, 3))
pgm.add_node(
    daft.Node(
        "sigma_a_prior",
        r"$\mathcal{N}(0, 10^5)$",
        3,
        4,
        fixed=True,
        offset=(0, 5)))
pgm.add_node(daft.Node("sigma_a", r"$\sigma_a$", 3, 3.5))
pgm.add_node(daft.Node("eps_a", r"$eps_a$", 3, 2.5, scale=1.25))
pgm.add_node(daft.Node("a", r"$a \sim \mathcal{Det}$", 1.5, 1.2, scale=1.5))

pgm.add_node(
    daft.Node(
        "sigma_prior",
        r"$\mathrm{U}(0, 100)$",
        4,
        3.5,
        fixed=True,
        offset=(20, 5)))
pgm.add_node(daft.Node("sigma_y", r"$\sigma_y$", 4, 2.5))
pgm.add_node(daft.Node("b_prior", r"$\mathcal{N}(0, 10^5)$", 5, 3, fixed=True))
pgm.add_node(daft.Node("b", r"$b$", 5, 2))

pgm.add_node(
    daft.Node(
        "y_i", r"$y_i \sim \mathcal{N}$", 4, 1, scale=1.25, observed=True))

pgm.add_edge("gamma_0_prior", "gamma_0")
pgm.add_edge("gamma_1_prior", "gamma_1")
pgm.add_edge("sigma_a_prior", "sigma_a")
pgm.add_edge("sigma_a", "eps_a")
pgm.add_edge("gamma_0", "a")
pgm.add_edge("gamma_1", "a")
pgm.add_edge("eps_a", "a")

pgm.add_edge("b_prior", "b")
pgm.add_edge("sigma_prior", "sigma_y")

pgm.add_edge("sigma_y", "y_i")
pgm.add_edge("a", "y_i")
pgm.add_edge("b", "y_i")
pgm.add_plate(daft.Plate([2.4, 1.7, 1.2, 1.4], "$i = 1:85$"))
pgm.add_plate(daft.Plate([0.9, 0.4, 1.2, 1.4], "$i = 1:919$"))
pgm.add_plate(daft.Plate([3.4, 0.2, 1.2, 1.4], "$i = 1:919$"))

pgm.render()
plt.show()
def hierarchical_intercepts_model(floor, county, log_uranium):
  """Creates a joint distribution for the varying slope model."""
  return tfd.JointDistributionSequential([
      tfd.HalfCauchy(loc=0., scale=5),  # sigma_a
      lambda sigma_a: tfd.MultivariateNormalDiag(  # eps_a
          loc=tf.zeros([num_counties]),
          scale_identity_multiplier=sigma_a),
      tfd.Normal(loc=0., scale=1e5),  # gamma_0
      tfd.Normal(loc=0., scale=1e5),  # gamma_1
      tfd.Normal(loc=0., scale=1e5),  # b
      tfd.Uniform(low=0., high=100),  # sigma_y
      lambda sigma_y, b, gamma_1, gamma_0, eps_a: tfd.
      MultivariateNormalDiag(  # y
          loc=affine(
              floor, b[..., tf.newaxis],
              affine(log_uranium, gamma_1[..., tf.newaxis],
                     gamma_0[..., tf.newaxis]) + tf.gather(eps_a, county, axis=-1)),
          scale_identity_multiplier=sigma_y)
  ])


def hierarchical_intercepts_log_prob(sigma_a, eps_a, gamma_0, gamma_1, b,
                                     sigma_y):
  """Computes joint log prob pinned at `log_radon`."""
  return hierarchical_intercepts_model(floor, county, log_uranium).log_prob(
      [sigma_a, eps_a, gamma_0, gamma_1, b, sigma_y, log_radon])
@tf.function
def sample_hierarchical_intercepts(num_chains, num_results, num_burnin_steps):
  """Samples from the hierarchical intercepts model."""
  hmc = tfp.mcmc.HamiltonianMonteCarlo(
      target_log_prob_fn=hierarchical_intercepts_log_prob,
      num_leapfrog_steps=10,
      step_size=0.01)

  initial_state = [
      tf.ones([num_chains], name='init_sigma_a'),
      tf.zeros([num_chains, num_counties], name='eps_a'),
      tf.zeros([num_chains], name='init_gamma_0'),
      tf.zeros([num_chains], name='init_gamma_1'),
      tf.zeros([num_chains], name='init_b'),
      tf.ones([num_chains], name='init_sigma_y')
  ]
  unconstraining_bijectors = [
      tfb.Exp(),       # sigma_a
      tfb.Identity(),  # eps_a
      tfb.Identity(),  # gamma_0
      tfb.Identity(),  # gamma_0
      tfb.Identity(),  # b
      # Maps reals to [0, 100].
      tfb.Chain([tfb.Shift(shift=50.),
                 tfb.Scale(scale=50.),
                 tfb.Tanh()])  # sigma_y
  ]
  kernel = tfp.mcmc.TransformedTransitionKernel(
      inner_kernel=hmc, bijector=unconstraining_bijectors)
  samples, kernel_results = tfp.mcmc.sample_chain(
      num_results=num_results,
      num_burnin_steps=num_burnin_steps,
      current_state=initial_state,
      kernel=kernel)

  acceptance_probs = tf.reduce_mean(
      tf.cast(kernel_results.inner_results.is_accepted, tf.float32), axis=0)

  return samples, acceptance_probs
HierarchicalInterceptsModel = collections.namedtuple(
    'HierarchicalInterceptsModel',
    ['sigma_a', 'eps_a', 'gamma_0', 'gamma_1', 'b', 'sigma_y'])

samples, acceptance_probs = sample_hierarchical_intercepts(
    num_chains=4, num_results=2000, num_burnin_steps=500)
print('Acceptance Probabilities: ', acceptance_probs.numpy())
hierarchical_intercepts_samples = HierarchicalInterceptsModel._make(samples)
Acceptance Probabilities: [0.9615 0.941 0.955 0.95 ]
for var in ['sigma_a', 'gamma_0', 'gamma_1', 'b', 'sigma_y']:
  print(
      'R-hat for', var, ':',
      tfp.mcmc.potential_scale_reduction(
          getattr(hierarchical_intercepts_samples, var)).numpy())
R-hat for sigma_a : 1.0469627
R-hat for gamma_0 : 1.0016835
R-hat for gamma_1 : 1.0097923
R-hat for b : 1.0014259
R-hat for sigma_y : 1.0025403
def plot_hierarchical_intercepts():
  mean_and_var = lambda x : [reduce_samples(x, fn) for fn in [np.mean, np.var]]
  gamma_0_mean, gamma_0_var = mean_and_var(
    hierarchical_intercepts_samples.gamma_0)
  gamma_1_mean, gamma_1_var = mean_and_var(
    hierarchical_intercepts_samples.gamma_1)
  eps_a_means, eps_a_vars  = mean_and_var(hierarchical_intercepts_samples.eps_a)

  mu_a_means = gamma_0_mean + gamma_1_mean * log_uranium
  mu_a_vars = gamma_0_var + np.square(log_uranium) * gamma_1_var
  a_means = mu_a_means + eps_a_means[county]
  a_stds = np.sqrt(mu_a_vars + eps_a_vars[county])

  plt.figure()
  plt.scatter(log_uranium, a_means, marker='.', c='C0')
  xvals = np.linspace(-1, 0.8)
  plt.plot(xvals,gamma_0_mean + gamma_1_mean * xvals, 'k--')
  plt.xlim(-1, 0.8)

  for ui, m, se in zip(log_uranium, a_means, a_stds):
    plt.plot([ui, ui], [m - se, m + se], 'C1-', alpha=0.1)
  plt.xlabel('County-level uranium')
  plt.ylabel('Intercept estimate')


plot_hierarchical_intercepts()
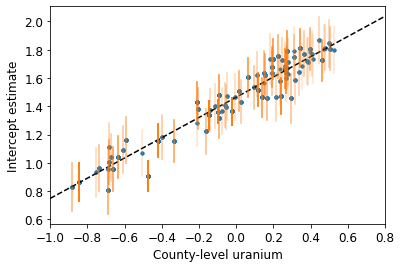
इंटरसेप्ट पर मानक त्रुटियां काउंटी-स्तरीय कोवरिएट के बिना आंशिक-पूलिंग मॉडल की तुलना में संकरी हैं।
6.2 स्तरों के बीच संबंध
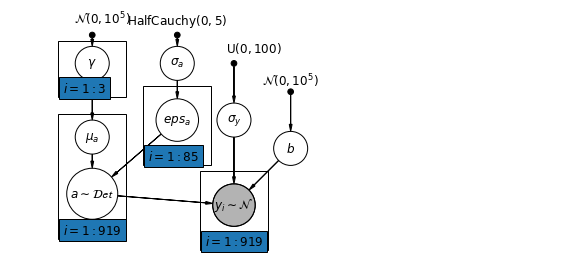
कुछ उदाहरणों में, कई स्तरों पर भविष्यवक्ता होने से व्यक्तिगत-स्तर के चर और समूह के अवशेषों के बीच संबंध का पता चल सकता है। हम समूह अवरोधन के लिए मॉडल में एक सहसंयोजक के रूप में व्यक्तिगत भविष्यवक्ताओं के औसत को शामिल करके इसका हिसाब लगा सकते हैं।
\(\alpha_j = \gamma_0 + \gamma_1 u_j + \gamma_2 \bar{x} + \zeta_j\) ये मोटे तौर पर प्रासंगिक प्रभाव के रूप में भेजा जाता है।
mpl.rc("font", size=12)
pgm = daft.PGM([10, 4.5], node_unit=1.2)
pgm.add_node(
    daft.Node(
        "gamma_prior",
        r"$\mathcal{N}(0, 10^5)$",
        1.5,
        4,
        fixed=True,
        offset=(10, 5)))
pgm.add_node(daft.Node("gamma", r"$\gamma$", 1.5, 3.5))
pgm.add_node(daft.Node("mu_a", r"$\mu_a$", 1.5, 2.2))
pgm.add_node(
    daft.Node(
        "sigma_a_prior",
        r"$\mathrm{HalfCauchy}(0, 5)$",
        3,
        4,
        fixed=True,
        offset=(0, 5)))
pgm.add_node(daft.Node("sigma_a", r"$\sigma_a$", 3, 3.5))
pgm.add_node(daft.Node("eps_a", r"$eps_a$", 3, 2.5, scale=1.25))
pgm.add_node(daft.Node("a", r"$a \sim \mathcal{Det}$", 1.5, 1.2, scale=1.5))

pgm.add_node(
    daft.Node(
        "sigma_prior",
        r"$\mathrm{U}(0, 100)$",
        4,
        3.5,
        fixed=True,
        offset=(20, 5)))
pgm.add_node(daft.Node("sigma_y", r"$\sigma_y$", 4, 2.5))
pgm.add_node(daft.Node("b_prior", r"$\mathcal{N}(0, 10^5)$", 5, 3, fixed=True))
pgm.add_node(daft.Node("b", r"$b$", 5, 2))

pgm.add_node(
    daft.Node(
        "y_i", r"$y_i \sim \mathcal{N}$", 4, 1, scale=1.25, observed=True))

pgm.add_edge("gamma_prior", "gamma")
pgm.add_edge("sigma_a_prior", "sigma_a")
pgm.add_edge("sigma_a", "eps_a")
pgm.add_edge("gamma", "mu_a")
pgm.add_edge("mu_a", "a")
pgm.add_edge("eps_a", "a")

pgm.add_edge("b_prior", "b")
pgm.add_edge("sigma_prior", "sigma_y")

pgm.add_edge("sigma_y", "y_i")
pgm.add_edge("a", "y_i")
pgm.add_edge("b", "y_i")
pgm.add_plate(daft.Plate([0.9, 2.9, 1.2, 1.0], "$i = 1:3$"))
pgm.add_plate(daft.Plate([2.4, 1.7, 1.2, 1.4], "$i = 1:85$"))
pgm.add_plate(daft.Plate([0.9, 0.4, 1.2, 2.2], "$i = 1:919$"))
pgm.add_plate(daft.Plate([3.4, 0.2, 1.2, 1.4], "$i = 1:919$"))

pgm.render()
plt.show()
# Create a new variable for mean of floor across counties
xbar = tf.convert_to_tensor(radon.groupby('county')['floor'].mean(), tf.float32)
xbar = tf.gather(xbar, county, axis=-1)
def contextual_effects_model(floor, county, log_uranium, xbar):
  """Creates a joint distribution for the varying slope model."""
  return tfd.JointDistributionSequential([
      tfd.HalfCauchy(loc=0., scale=5),  # sigma_a
      lambda sigma_a: tfd.MultivariateNormalDiag(  # eps_a
          loc=tf.zeros([num_counties]),
          scale_identity_multiplier=sigma_a),
      tfd.Normal(loc=0., scale=1e5),  # gamma_0
      tfd.Normal(loc=0., scale=1e5),  # gamma_1
      tfd.Normal(loc=0., scale=1e5),  # gamma_2
      tfd.Normal(loc=0., scale=1e5),  # b
      tfd.Uniform(low=0., high=100),  # sigma_y
      lambda sigma_y, b, gamma_2, gamma_1, gamma_0, eps_a: tfd.
      MultivariateNormalDiag(  # y
          loc=affine(
              floor, b[..., tf.newaxis],
              affine(log_uranium, gamma_1[..., tf.newaxis], gamma_0[
                  ..., tf.newaxis]) + affine(xbar, gamma_2[..., tf.newaxis]) +
              tf.gather(eps_a, county, axis=-1)),
          scale_identity_multiplier=sigma_y)
  ])


def contextual_effects_log_prob(sigma_a, eps_a, gamma_0, gamma_1, gamma_2, b,
                                sigma_y):
  """Computes joint log prob pinned at `log_radon`."""
  return contextual_effects_model(floor, county, log_uranium, xbar).log_prob(
      [sigma_a, eps_a, gamma_0, gamma_1, gamma_2, b, sigma_y, log_radon])
@tf.function
def sample_contextual_effects(num_chains, num_results, num_burnin_steps):
  """Samples from the hierarchical intercepts model."""
  hmc = tfp.mcmc.HamiltonianMonteCarlo(
      target_log_prob_fn=contextual_effects_log_prob,
      num_leapfrog_steps=10,
      step_size=0.01)

  initial_state = [
      tf.ones([num_chains], name='init_sigma_a'),
      tf.zeros([num_chains, num_counties], name='eps_a'),
      tf.zeros([num_chains], name='init_gamma_0'),
      tf.zeros([num_chains], name='init_gamma_1'),
      tf.zeros([num_chains], name='init_gamma_2'),
      tf.zeros([num_chains], name='init_b'),
      tf.ones([num_chains], name='init_sigma_y')
  ]
  unconstraining_bijectors = [
      tfb.Exp(),       # sigma_a
      tfb.Identity(),  # eps_a
      tfb.Identity(),  # gamma_0
      tfb.Identity(),  # gamma_1
      tfb.Identity(),  # gamma_2
      tfb.Identity(),  # b
      tfb.Chain([tfb.Shift(shift=50.),
                 tfb.Scale(scale=50.),
                 tfb.Tanh()])  # sigma_y
  ]
  kernel = tfp.mcmc.TransformedTransitionKernel(
      inner_kernel=hmc, bijector=unconstraining_bijectors)
  samples, kernel_results = tfp.mcmc.sample_chain(
      num_results=num_results,
      num_burnin_steps=num_burnin_steps,
      current_state=initial_state,
      kernel=kernel)

  acceptance_probs = tf.reduce_mean(
      tf.cast(kernel_results.inner_results.is_accepted, tf.float32), axis=0)

  return samples, acceptance_probs
ContextualEffectsModel = collections.namedtuple(
    'ContextualEffectsModel',
    ['sigma_a', 'eps_a', 'gamma_0', 'gamma_1', 'gamma_2', 'b', 'sigma_y'])

samples, acceptance_probs = sample_contextual_effects(
    num_chains=4, num_results=2000, num_burnin_steps=500)
print('Acceptance Probabilities: ', acceptance_probs.numpy())
contextual_effects_samples = ContextualEffectsModel._make(samples)
Acceptance Probabilities: [0.9505 0.9595 0.951 0.9535]
for var in ['sigma_a', 'gamma_0', 'gamma_1', 'gamma_2', 'b', 'sigma_y']:
  print(
      'R-hat for ', var, ': ',
      tfp.mcmc.potential_scale_reduction(
          getattr(contextual_effects_samples, var)).numpy())
R-hat for  sigma_a :  1.0709597
R-hat for  gamma_0 :  1.0067923
R-hat for  gamma_1 :  1.0089629
R-hat for  gamma_2 :  1.0054177
R-hat for  b :  1.0018929
R-hat for  sigma_y :  1.0032713
for var in ['gamma_0', 'gamma_1', 'gamma_2']:
  var_samples = getattr(contextual_effects_samples, var)
  mean = var_samples.numpy().mean()
  std = var_samples.numpy().std()
  r_hat = tfp.mcmc.potential_scale_reduction(var_samples).numpy()
  n_eff = tfp.mcmc.effective_sample_size(var_samples).numpy().sum()

  print(var, ' mean: ', mean, ' std: ', std, ' n_eff: ', n_eff, ' r_hat: ',
        r_hat)
gamma_0  mean:  1.3934746  std:  0.04966602  n_eff:  816.21265  r_hat:  1.0067923
gamma_1  mean:  0.7229424  std:  0.088611916  n_eff:  1462.486  r_hat:  1.0089629
gamma_2  mean:  0.40893936  std:  0.20304097  n_eff:  457.8165  r_hat:  1.0054177
इसलिए, हम इससे यह अनुमान लगा सकते हैं कि बिना बेसमेंट वाले घरों के उच्च अनुपात वाले काउंटियों में रेडॉन के उच्च आधारभूत स्तर होते हैं। शायद यह मिट्टी के प्रकार से संबंधित है, जो बदले में प्रभावित कर सकता है कि किस प्रकार की संरचनाएं बनाई गई हैं।
6.3 भविष्यवाणी
गेलमैन (2006) ने अनपूल्ड, पूल्ड और आंशिक रूप से पूल किए गए मॉडल की भविष्यवाणी त्रुटि की जांच के लिए क्रॉस-वेलिडेशन टेस्ट का इस्तेमाल किया।
रूट माध्य वर्ग क्रॉस-सत्यापन भविष्यवाणी त्रुटियाँ:
- अनपूल्ड = 0.86
- जमा = 0.84
- बहुस्तरीय = 0.79
बहुस्तरीय मॉडल में दो प्रकार की भविष्यवाणी की जा सकती है:
- मौजूदा समूह के भीतर एक नया व्यक्ति
- एक नए समूह के भीतर एक नया व्यक्ति
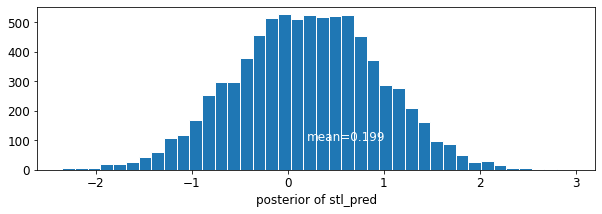
उदाहरण के लिए, यदि हम सेंट लुइस काउंटी में बिना बेसमेंट वाले नए घर के लिए भविष्यवाणी करना चाहते हैं, तो हमें उपयुक्त इंटरसेप्ट के साथ रेडॉन मॉडल से नमूना लेना होगा।
county_name.index('St Louis')
69
अर्थात्,
\[\tilde{y}_i \sim N(\alpha_{69} + \beta (x_i=1), \sigma_y^2)\]
st_louis_log_uranium = tf.convert_to_tensor(
    radon.where(radon['county'] == 69)['log_uranium_ppm'].mean(), tf.float32)
st_louis_xbar = tf.convert_to_tensor(
    radon.where(radon['county'] == 69)['floor'].mean(), tf.float32)
@tf.function
def intercept_a(gamma_0, gamma_1, gamma_2, eps_a, log_uranium, xbar, county):
  return (affine(log_uranium, gamma_1, gamma_0) + affine(xbar, gamma_2) +
          tf.gather(eps_a, county, axis=-1))


def contextual_effects_predictive_model(floor, county, log_uranium, xbar,
                                        st_louis_log_uranium, st_louis_xbar):
  """Creates a joint distribution for the contextual effects model."""
  return tfd.JointDistributionSequential([
      tfd.HalfCauchy(loc=0., scale=5),  # sigma_a
      lambda sigma_a: tfd.MultivariateNormalDiag(  # eps_a
          loc=tf.zeros([num_counties]),
          scale_identity_multiplier=sigma_a),
      tfd.Normal(loc=0., scale=1e5),  # gamma_0
      tfd.Normal(loc=0., scale=1e5),  # gamma_1
      tfd.Normal(loc=0., scale=1e5),  # gamma_2
      tfd.Normal(loc=0., scale=1e5),  # b
      tfd.Uniform(low=0., high=100),  # sigma_y
      # y
      lambda sigma_y, b, gamma_2, gamma_1, gamma_0, eps_a: (
        tfd.MultivariateNormalDiag(
          loc=affine(
              floor, b[..., tf.newaxis],
              intercept_a(gamma_0[..., tf.newaxis],
                          gamma_1[..., tf.newaxis], gamma_2[..., tf.newaxis],
                          eps_a, log_uranium, xbar, county)),
          scale_identity_multiplier=sigma_y)),
      # stl_pred
      lambda _, sigma_y, b, gamma_2, gamma_1, gamma_0, eps_a: tfd.Normal(
          loc=intercept_a(gamma_0, gamma_1, gamma_2, eps_a,
                          st_louis_log_uranium, st_louis_xbar, 69) + b,
          scale=sigma_y)
  ])


@tf.function
def contextual_effects_predictive_log_prob(sigma_a, eps_a, gamma_0, gamma_1,
                                           gamma_2, b, sigma_y, stl_pred):
  """Computes joint log prob pinned at `log_radon`."""
  return contextual_effects_predictive_model(floor, county, log_uranium, xbar,
                                             st_louis_log_uranium,
                                             st_louis_xbar).log_prob([
                                                 sigma_a, eps_a, gamma_0,
                                                 gamma_1, gamma_2, b, sigma_y,
                                                 log_radon, stl_pred
                                             ])
@tf.function
def sample_contextual_effects_predictive(num_chains, num_results,
                                         num_burnin_steps):
  """Samples from the contextual effects predictive model."""
  hmc = tfp.mcmc.HamiltonianMonteCarlo(
      target_log_prob_fn=contextual_effects_predictive_log_prob,
      num_leapfrog_steps=50,
      step_size=0.01)

  initial_state = [
      tf.ones([num_chains], name='init_sigma_a'),
      tf.zeros([num_chains, num_counties], name='eps_a'),
      tf.zeros([num_chains], name='init_gamma_0'),
      tf.zeros([num_chains], name='init_gamma_1'),
      tf.zeros([num_chains], name='init_gamma_2'),
      tf.zeros([num_chains], name='init_b'),
      tf.ones([num_chains], name='init_sigma_y'),
      tf.zeros([num_chains], name='init_stl_pred')
  ]
  unconstraining_bijectors = [
      tfb.Exp(),       # sigma_a
      tfb.Identity(),  # eps_a
      tfb.Identity(),  # gamma_0
      tfb.Identity(),  # gamma_1
      tfb.Identity(),  # gamma_2
      tfb.Identity(),  # b
      tfb.Chain([tfb.Shift(shift=50.),
                 tfb.Scale(scale=50.),
                 tfb.Tanh()]),  # sigma_y
      tfb.Identity(),  # stl_pred
  ]
  kernel = tfp.mcmc.TransformedTransitionKernel(
      inner_kernel=hmc, bijector=unconstraining_bijectors)
  samples, kernel_results = tfp.mcmc.sample_chain(
      num_results=num_results,
      num_burnin_steps=num_burnin_steps,
      current_state=initial_state,
      kernel=kernel)

  acceptance_probs = tf.reduce_mean(
      tf.cast(kernel_results.inner_results.is_accepted, tf.float32), axis=0)

  return samples, acceptance_probs
ContextualEffectsPredictiveModel = collections.namedtuple(
    'ContextualEffectsPredictiveModel', [
        'sigma_a', 'eps_a', 'gamma_0', 'gamma_1', 'gamma_2', 'b', 'sigma_y',
        'stl_pred'
    ])

samples, acceptance_probs = sample_contextual_effects_predictive(
    num_chains=4, num_results=2000, num_burnin_steps=500)
print('Acceptance Probabilities: ', acceptance_probs.numpy())
contextual_effects_pred_samples = ContextualEffectsPredictiveModel._make(
    samples)
Acceptance Probabilities: [0.9165 0.978 0.9755 0.9785]
for var in [
    'sigma_a', 'gamma_0', 'gamma_1', 'gamma_2', 'b', 'sigma_y', 'stl_pred'
]:
  print(
      'R-hat for ', var, ': ',
      tfp.mcmc.potential_scale_reduction(
          getattr(contextual_effects_pred_samples, var)).numpy())
R-hat for  sigma_a :  1.0325582
R-hat for  gamma_0 :  1.0033548
R-hat for  gamma_1 :  1.0011047
R-hat for  gamma_2 :  1.001153
R-hat for  b :  1.0020066
R-hat for  sigma_y :  1.0128921
R-hat for  stl_pred :  1.0058256
plot_traces('stl_pred', contextual_effects_pred_samples.stl_pred, num_chains=4)

plot_posterior('stl_pred', contextual_effects_pred_samples.stl_pred)
7। निष्कर्ष
बहुस्तरीय मॉडल के लाभ:
- अवलोकन संबंधी डेटा की प्राकृतिक पदानुक्रमित संरचना के लिए लेखांकन।
- (कम प्रतिनिधित्व वाले) समूहों के लिए गुणांक का अनुमान।
- समूह-स्तर के गुणांकों का आकलन करते समय व्यक्तिगत और समूह-स्तर की जानकारी शामिल करना।
- समूहों में व्यक्तिगत-स्तर के गुणांकों में भिन्नता की अनुमति देना।
संदर्भ
जेलमैन, ए., और हिल, जे. (2006). प्रतिगमन और बहुस्तरीय/पदानुक्रमित मॉडल का उपयोग करके डेटा विश्लेषण (पहला संस्करण)। कैम्ब्रिज यूनिवर्सिटी प्रेस।
जेलमैन, ए। (2006)। बहुस्तरीय (पदानुक्रमित) मॉडलिंग: यह क्या कर सकता है और क्या नहीं। टेक्नोमेट्रिक्स, 48(3), 432–435।
