 Xem trên TensorFlow.org Xem trên TensorFlow.org |  Chạy trong Google Colab Chạy trong Google Colab |  Xem nguồn trên GitHub Xem nguồn trên GitHub |  Tải xuống sổ ghi chép Tải xuống sổ ghi chép |
Trong chuyên mục này, chúng ta khám phá hồi quy quy trình Gaussian bằng cách sử dụng TensorFlow và TensorFlow Probability. Chúng tôi tạo ra một số quan sát nhiễu từ một số chức năng đã biết và phù hợp với các mô hình GP với những dữ liệu đó. Sau đó, chúng tôi lấy mẫu từ phần sau của GP và vẽ biểu đồ các giá trị hàm được lấy mẫu trên các lưới trong miền của chúng.
Lý lịch
Hãy \(\mathcal{X}\) được bất kỳ quy định. Một quá trình Gaussian (GP) là một tập hợp các biến ngẫu nhiên được lập chỉ mục bởi \(\mathcal{X}\) ví dụ rằng nếu\(\{X_1, \ldots, X_n\} \subset \mathcal{X}\) là bất kỳ tập con hữu hạn, mật độ biên\(p(X_1 = x_1, \ldots, X_n = x_n)\) là đa biến Gaussian. Bất kỳ phân phối Gaussian nào cũng được xác định hoàn toàn bởi các mômen trung tâm thứ nhất và thứ hai của nó (trung bình và hiệp phương sai), và GP cũng không ngoại lệ. Chúng ta có thể chỉ định một GP hoàn toàn về mặt ý nghĩa chức năng của nó \(\mu : \mathcal{X} \to \mathbb{R}\) và hiệp phương sai chức năng\(k : \mathcal{X} \times \mathcal{X} \to \mathbb{R}\). Hầu hết sức mạnh biểu đạt của GP được gói gọn trong sự lựa chọn của hàm hiệp phương sai. Vì những lý do khác nhau, hàm hiệp phương sai cũng được gọi là một hàm kernel. Nó là cần thiết chỉ là đối xứng và tích cực-định (xem Ch. 4 của Rasmussen & Williams ). Dưới đây, chúng tôi sử dụng hạt nhân hiệp phương sai ExponentiatedQuadratic. Hình thức của nó là
\[ k(x, x') := \sigma^2 \exp \left( \frac{\|x - x'\|^2}{\lambda^2} \right) \]
nơi \(\sigma^2\) được gọi là 'biên độ' và \(\lambda\) quy mô chiều dài. Các tham số hạt nhân có thể được chọn thông qua một quy trình tối ưu hóa khả năng xảy ra tối đa.
Một mẫu đầy đủ từ một GP bao gồm một hàm giá trị thực so với không gian toàn bộ\(\mathcal{X}\) và là trong thực tế không thực tế để thực hiện; thường người ta chọn một tập hợp các điểm để quan sát một mẫu và vẽ các giá trị hàm tại các điểm này. Điều này đạt được bằng cách lấy mẫu từ Gaussian đa biến thể thích hợp (hữu hạn chiều).
Lưu ý rằng, theo định nghĩa trên, bất kỳ phân phối Gaussian đa biến hữu hạn chiều nào cũng là một quá trình Gauss. Thông thường, khi một đề cập đến một GP, nó là ngầm rằng bộ chỉ số là một số \(\mathbb{R}^n\)và chúng tôi thực sự sẽ làm cho giả thuyết này ở đây.
Một ứng dụng phổ biến của quy trình Gauss trong học máy là hồi quy quy trình Gauss. Ý tưởng là chúng ta muốn ước tính một chức năng chưa biết được quan sát ồn ào \(\{y_1, \ldots, y_N\}\) của hàm tại một số hữu hạn các điểm \(\{x_1, \ldots x_N\}.\) Chúng tôi hình dung một quá trình sinh sản
\[ \begin{align} f \sim \: & \textsf{GaussianProcess}\left( \text{mean_fn}=\mu(x), \text{covariance_fn}=k(x, x')\right) \\ y_i \sim \: & \textsf{Normal}\left( \text{loc}=f(x_i), \text{scale}=\sigma\right), i = 1, \ldots, N \end{align} \]
Như đã lưu ý ở trên, không thể tính toán hàm được lấy mẫu, vì chúng ta yêu cầu giá trị của nó ở một số điểm vô hạn. Thay vào đó, người ta coi một mẫu hữu hạn từ Gaussian đa biến.
\[ \begin{gather} \begin{bmatrix} f(x_1) \\ \vdots \\ f(x_N) \end{bmatrix} \sim \textsf{MultivariateNormal} \left( \: \text{loc}= \begin{bmatrix} \mu(x_1) \\ \vdots \\ \mu(x_N) \end{bmatrix} \:,\: \text{scale}= \begin{bmatrix} k(x_1, x_1) & \cdots & k(x_1, x_N) \\ \vdots & \ddots & \vdots \\ k(x_N, x_1) & \cdots & k(x_N, x_N) \\ \end{bmatrix}^{1/2} \: \right) \end{gather} \\ y_i \sim \textsf{Normal} \left( \text{loc}=f(x_i), \text{scale}=\sigma \right) \]
Lưu ý số mũ \(\frac{1}{2}\) trên ma trận hiệp phương sai: đây biểu thị một phân hủy Cholesky. Việc cải tiến Cholesky là cần thiết vì MVN là hệ thống phân phối gia đình ở quy mô địa điểm. Đáng tiếc là sự phân hủy Cholesky là đắt tiền nên tham \(O(N^3)\) thời gian và \(O(N^2)\) không gian. Phần lớn các tài liệu về GP tập trung vào việc giải quyết số mũ nhỏ có vẻ vô thưởng vô phạt này.
Người ta thường coi hàm trung bình trước là hằng số, thường là số 0. Ngoài ra, một số quy ước ký hiệu rất tiện lợi. Một thường viết \(\mathbf{f}\) cho vectơ hữu hạn các giá trị chức năng lấy mẫu. Một số ký hiệu thú vị được sử dụng cho các ma trận hiệp phương sai kết quả từ việc áp dụng \(k\) cho mỗi cặp đầu vào. Sau (Quiñonero-Candela, 2005) , chúng tôi lưu ý rằng các thành phần của ma trận là hiệp phương sai của giá trị chức năng tại các điểm đầu vào cụ thể. Như vậy chúng ta có thể biểu thị ma trận hiệp phương sai như \(K_{AB}\)nơi \(A\) và \(B\) là một số chỉ tiêu của bộ sưu tập của các giá trị chức năng dọc theo kích thước ma trận cho trước.
Ví dụ, với dữ liệu quan sát \((\mathbf{x}, \mathbf{y})\) với các giá trị chức năng tiềm ẩn ngụ ý \(\mathbf{f}\), chúng ta có thể viết
\[ K_{\mathbf{f},\mathbf{f} } = \begin{bmatrix} k(x_1, x_1) & \cdots & k(x_1, x_N) \\ \vdots & \ddots & \vdots \\ k(x_N, x_1) & \cdots & k(x_N, x_N) \\ \end{bmatrix} \]
Tương tự, chúng ta có thể kết hợp các bộ đầu vào, như trong
\[ K_{\mathbf{f},*} = \begin{bmatrix} k(x_1, x^*_1) & \cdots & k(x_1, x^*_T) \\ \vdots & \ddots & \vdots \\ k(x_N, x^*_1) & \cdots & k(x_N, x^*_T) \\ \end{bmatrix} \]
nơi mà chúng tôi cho rằng có những \(N\) đầu vào đào tạo, và \(T\) đầu vào thử nghiệm. Quá trình phát sinh ở trên sau đó có thể được viết ngắn gọn là
\[ \begin{align} \mathbf{f} \sim \: & \textsf{MultivariateNormal} \left( \text{loc}=\mathbf{0}, \text{scale}=K_{\mathbf{f},\mathbf{f} }^{1/2} \right) \\ y_i \sim \: & \textsf{Normal} \left( \text{loc}=f_i, \text{scale}=\sigma \right), i = 1, \ldots, N \end{align} \]
Các hoạt động lấy mẫu trong dòng đầu tiên mang lại một tập hữu hạn các \(N\) giá trị chức năng từ một Gaussian đa biến - không phải là một toàn bộ chức năng như trong các ký hiệu trên GP vẽ. Dòng thứ hai mô tả một tập hợp các \(N\) rút ra từ đơn biến Gaussian tập trung ở các giá trị chức năng khác nhau, với cố định quan sát tiếng ồn \(\sigma^2\).
Với mô hình suy ra ở trên, chúng ta có thể tiến hành xem xét bài toán suy luận hậu nghiệm. Điều này tạo ra một phân phối sau trên các giá trị hàm tại một tập hợp các điểm kiểm tra mới, được điều kiện hóa dựa trên dữ liệu nhiễu quan sát được từ quá trình trên.
Với các ký hiệu trên tại chỗ, chúng ta có thể viết gọn phân phối dự đoán sau hơn trong tương lai (ồn ào) quan sát có điều kiện đầu vào và dữ liệu đào tạo tương ứng như sau (để biết thêm chi tiết, xem §2.2 của Rasmussen & Williams ).
\[ \mathbf{y}^* \mid \mathbf{x}^*, \mathbf{x}, \mathbf{y} \sim \textsf{Normal} \left( \text{loc}=\mathbf{\mu}^*, \text{scale}=(\Sigma^*)^{1/2} \right), \]
ở đâu
\[ \mathbf{\mu}^* = K_{*,\mathbf{f} }\left(K_{\mathbf{f},\mathbf{f} } + \sigma^2 I \right)^{-1} \mathbf{y} \]
và
\[ \Sigma^* = K_{*,*} - K_{*,\mathbf{f} } \left(K_{\mathbf{f},\mathbf{f} } + \sigma^2 I \right)^{-1} K_{\mathbf{f},*} \]
Nhập khẩu
import time

import numpy as np
import matplotlib.pyplot as plt
import tensorflow.compat.v2 as tf
import tensorflow_probability as tfp
tfb = tfp.bijectors
tfd = tfp.distributions
tfk = tfp.math.psd_kernels
tf.enable_v2_behavior()

from mpl_toolkits.mplot3d import Axes3D
%pylab inline
# Configure plot defaults
plt.rcParams['axes.facecolor'] = 'white'
plt.rcParams['grid.color'] = '#666666'
%config InlineBackend.figure_format = 'png'
Populating the interactive namespace from numpy and matplotlib
Ví dụ: Hồi quy GP chính xác trên dữ liệu hình sin ồn ào
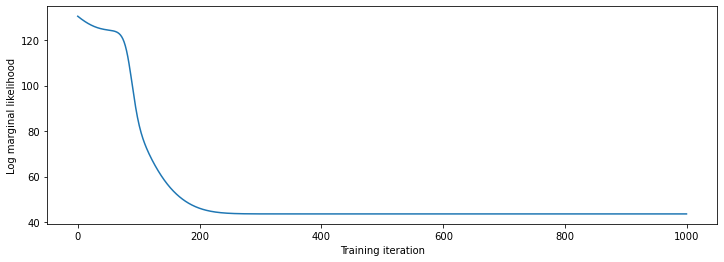
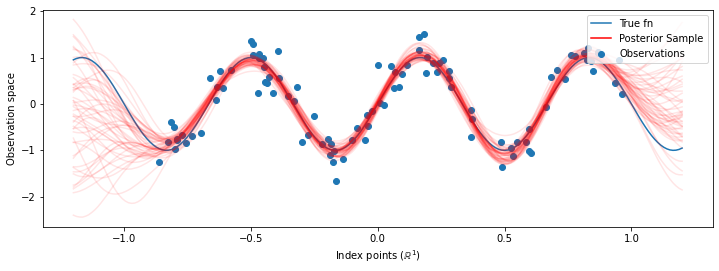
Ở đây chúng tôi tạo dữ liệu huấn luyện từ một hình sin nhiễu, sau đó lấy mẫu một loạt các đường cong từ phần sau của mô hình hồi quy GP. Chúng tôi sử dụng Adam để tối ưu hóa các siêu hạt nhân (chúng tôi hạn chế tối đa khả năng ghi âm của các dữ liệu dưới trước). Chúng tôi vẽ đường cong đào tạo, theo sau là hàm true và các mẫu hậu kỳ.
def sinusoid(x):
  return np.sin(3 * np.pi * x[..., 0])

def generate_1d_data(num_training_points, observation_noise_variance):
  """Generate noisy sinusoidal observations at a random set of points.

  Returns:
     observation_index_points, observations
  """
  index_points_ = np.random.uniform(-1., 1., (num_training_points, 1))
  index_points_ = index_points_.astype(np.float64)
  # y = f(x) + noise
  observations_ = (sinusoid(index_points_) +
                   np.random.normal(loc=0,
                                    scale=np.sqrt(observation_noise_variance),
                                    size=(num_training_points)))
  return index_points_, observations_
# Generate training data with a known noise level (we'll later try to recover
# this value from the data).
NUM_TRAINING_POINTS = 100
observation_index_points_, observations_ = generate_1d_data(
    num_training_points=NUM_TRAINING_POINTS,
    observation_noise_variance=.1)
Chúng tôi sẽ đưa priors trên các siêu hạt nhân, và viết phân phối chung của các siêu dữ liệu và quan sát sử dụng tfd.JointDistributionNamed .
def build_gp(amplitude, length_scale, observation_noise_variance):
  """Defines the conditional dist. of GP outputs, given kernel parameters."""

  # Create the covariance kernel, which will be shared between the prior (which we
  # use for maximum likelihood training) and the posterior (which we use for
  # posterior predictive sampling)
  kernel = tfk.ExponentiatedQuadratic(amplitude, length_scale)

  # Create the GP prior distribution, which we will use to train the model
  # parameters.
  return tfd.GaussianProcess(
      kernel=kernel,
      index_points=observation_index_points_,
      observation_noise_variance=observation_noise_variance)

gp_joint_model = tfd.JointDistributionNamed({
    'amplitude': tfd.LogNormal(loc=0., scale=np.float64(1.)),
    'length_scale': tfd.LogNormal(loc=0., scale=np.float64(1.)),
    'observation_noise_variance': tfd.LogNormal(loc=0., scale=np.float64(1.)),
    'observations': build_gp,
})
Chúng tôi có thể kiểm tra sự thực hiện của mình một cách tỉnh táo bằng cách xác minh rằng chúng tôi có thể lấy mẫu từ trước đó và tính toán mật độ nhật ký của một mẫu.
x = gp_joint_model.sample()
lp = gp_joint_model.log_prob(x)

print("sampled {}".format(x))
print("log_prob of sample: {}".format(lp))
sampled {'observation_noise_variance': <tf.Tensor: shape=(), dtype=float64, numpy=2.067952217184325>, 'length_scale': <tf.Tensor: shape=(), dtype=float64, numpy=1.154435715487831>, 'amplitude': <tf.Tensor: shape=(), dtype=float64, numpy=5.383850737703549>, 'observations': <tf.Tensor: shape=(100,), dtype=float64, numpy=
array([-2.37070577, -2.05363838, -0.95152824,  3.73509388, -0.2912646 ,
        0.46112342, -1.98018513, -2.10295857, -1.33589756, -2.23027226,
       -2.25081374, -0.89450835, -2.54196452,  1.46621647,  2.32016193,
        5.82399989,  2.27241034, -0.67523432, -1.89150197, -1.39834474,
       -2.33954116,  0.7785609 , -1.42763627, -0.57389025, -0.18226098,
       -3.45098732,  0.27986652, -3.64532398, -1.28635204, -2.42362875,
        0.01107288, -2.53222176, -2.0886136 , -5.54047694, -2.18389607,
       -1.11665628, -3.07161217, -2.06070336, -0.84464262,  1.29238438,
       -0.64973999, -2.63805504, -3.93317576,  0.65546645,  2.24721181,
       -0.73403676,  5.31628298, -1.2208384 ,  4.77782252, -1.42978168,
       -3.3089274 ,  3.25370494,  3.02117591, -1.54862932, -1.07360811,
        1.2004856 , -4.3017773 , -4.95787789, -1.95245901, -2.15960839,
       -3.78592731, -1.74096185,  3.54891595,  0.56294143,  1.15288455,
       -0.77323696,  2.34430694, -1.05302007, -0.7514684 , -0.98321063,
       -3.01300144, -3.00033274,  0.44200837,  0.45060886, -1.84497318,
       -1.89616746, -2.15647664, -2.65672581, -3.65493379,  1.70923375,
       -3.88695218, -0.05151283,  4.51906677, -2.28117003,  3.03032793,
       -1.47713194, -0.35625273,  3.73501587, -2.09328047, -0.60665614,
       -0.78177188, -0.67298545,  2.97436033, -0.29407932,  2.98482427,
       -1.54951178,  2.79206821,  4.2225733 ,  2.56265198,  2.80373284])>}
log_prob of sample: -194.96442183797524
Bây giờ hãy tối ưu hóa để tìm các giá trị tham số có xác suất sau cao nhất. Chúng tôi sẽ xác định một biến cho mỗi tham số và giới hạn các giá trị của chúng là số dương.
# Create the trainable model parameters, which we'll subsequently optimize.
# Note that we constrain them to be strictly positive.

constrain_positive = tfb.Shift(np.finfo(np.float64).tiny)(tfb.Exp())

amplitude_var = tfp.util.TransformedVariable(
    initial_value=1.,
    bijector=constrain_positive,
    name='amplitude',
    dtype=np.float64)

length_scale_var = tfp.util.TransformedVariable(
    initial_value=1.,
    bijector=constrain_positive,
    name='length_scale',
    dtype=np.float64)

observation_noise_variance_var = tfp.util.TransformedVariable(
    initial_value=1.,
    bijector=constrain_positive,
    name='observation_noise_variance_var',
    dtype=np.float64)

trainable_variables = [v.trainable_variables[0] for v in
                       [amplitude_var,
                       length_scale_var,
                       observation_noise_variance_var]]
Để điều kiện mô hình trên dữ liệu quan sát của chúng tôi, chúng tôi sẽ xác định một target_log_prob chức năng, trong đó có các (vẫn còn để được suy ra) siêu tham số kernel.
def target_log_prob(amplitude, length_scale, observation_noise_variance):
  return gp_joint_model.log_prob({
      'amplitude': amplitude,
      'length_scale': length_scale,
      'observation_noise_variance': observation_noise_variance,
      'observations': observations_
  })
# Now we optimize the model parameters.
num_iters = 1000
optimizer = tf.optimizers.Adam(learning_rate=.01)

# Use `tf.function` to trace the loss for more efficient evaluation.
@tf.function(autograph=False, jit_compile=False)
def train_model():
  with tf.GradientTape() as tape:
    loss = -target_log_prob(amplitude_var, length_scale_var,
                            observation_noise_variance_var)
  grads = tape.gradient(loss, trainable_variables)
  optimizer.apply_gradients(zip(grads, trainable_variables))
  return loss

# Store the likelihood values during training, so we can plot the progress
lls_ = np.zeros(num_iters, np.float64)
for i in range(num_iters):
  loss = train_model()
  lls_[i] = loss

print('Trained parameters:')
print('amplitude: {}'.format(amplitude_var._value().numpy()))
print('length_scale: {}'.format(length_scale_var._value().numpy()))
print('observation_noise_variance: {}'.format(observation_noise_variance_var._value().numpy()))
Trained parameters:
amplitude: 0.9176153445125278
length_scale: 0.18444082442910079
observation_noise_variance: 0.0880273312850989
# Plot the loss evolution
plt.figure(figsize=(12, 4))
plt.plot(lls_)
plt.xlabel("Training iteration")
plt.ylabel("Log marginal likelihood")
plt.show()

# Having trained the model, we'd like to sample from the posterior conditioned
# on observations. We'd like the samples to be at points other than the training
# inputs.
predictive_index_points_ = np.linspace(-1.2, 1.2, 200, dtype=np.float64)
# Reshape to [200, 1] -- 1 is the dimensionality of the feature space.
predictive_index_points_ = predictive_index_points_[..., np.newaxis]

optimized_kernel = tfk.ExponentiatedQuadratic(amplitude_var, length_scale_var)
gprm = tfd.GaussianProcessRegressionModel(
    kernel=optimized_kernel,
    index_points=predictive_index_points_,
    observation_index_points=observation_index_points_,
    observations=observations_,
    observation_noise_variance=observation_noise_variance_var,
    predictive_noise_variance=0.)

# Create op to draw  50 independent samples, each of which is a *joint* draw
# from the posterior at the predictive_index_points_. Since we have 200 input
# locations as defined above, this posterior distribution over corresponding
# function values is a 200-dimensional multivariate Gaussian distribution!
num_samples = 50
samples = gprm.sample(num_samples)
# Plot the true function, observations, and posterior samples.
plt.figure(figsize=(12, 4))
plt.plot(predictive_index_points_, sinusoid(predictive_index_points_),
         label='True fn')
plt.scatter(observation_index_points_[:, 0], observations_,
            label='Observations')
for i in range(num_samples):
  plt.plot(predictive_index_points_, samples[i, :], c='r', alpha=.1,
           label='Posterior Sample' if i == 0 else None)
leg = plt.legend(loc='upper right')
for lh in leg.legendHandles:
    lh.set_alpha(1)
plt.xlabel(r"Index points ($\mathbb{R}^1$)")
plt.ylabel("Observation space")
plt.show()

Biên siêu tham số với HMC
Thay vì tối ưu hóa các siêu tham số, hãy thử tích hợp chúng với Hamiltonian Monte Carlo. Đầu tiên chúng ta sẽ xác định và chạy một bộ lấy mẫu để rút ra gần đúng từ phân phối phía sau qua các siêu tham số hạt nhân, dựa trên các quan sát.
num_results = 100
num_burnin_steps = 50

sampler = tfp.mcmc.TransformedTransitionKernel(
    tfp.mcmc.NoUTurnSampler(
        target_log_prob_fn=target_log_prob,
        step_size=tf.cast(0.1, tf.float64)),
    bijector=[constrain_positive, constrain_positive, constrain_positive])

adaptive_sampler = tfp.mcmc.DualAveragingStepSizeAdaptation(
    inner_kernel=sampler,
    num_adaptation_steps=int(0.8 * num_burnin_steps),
    target_accept_prob=tf.cast(0.75, tf.float64))

initial_state = [tf.cast(x, tf.float64) for x in [1., 1., 1.]]
# Speed up sampling by tracing with `tf.function`.
@tf.function(autograph=False, jit_compile=False)
def do_sampling():
  return tfp.mcmc.sample_chain(
      kernel=adaptive_sampler,
      current_state=initial_state,
      num_results=num_results,
      num_burnin_steps=num_burnin_steps,
      trace_fn=lambda current_state, kernel_results: kernel_results)

t0 = time.time()
samples, kernel_results = do_sampling()
t1 = time.time()
print("Inference ran in {:.2f}s.".format(t1-t0))
Inference ran in 9.00s.
Hãy tỉnh táo-kiểm tra bộ lấy mẫu bằng cách kiểm tra các dấu vết siêu thông số.
(amplitude_samples,
 length_scale_samples,
 observation_noise_variance_samples) = samples

f = plt.figure(figsize=[15, 3])
for i, s in enumerate(samples):
  ax = f.add_subplot(1, len(samples) + 1, i + 1)
  ax.plot(s)

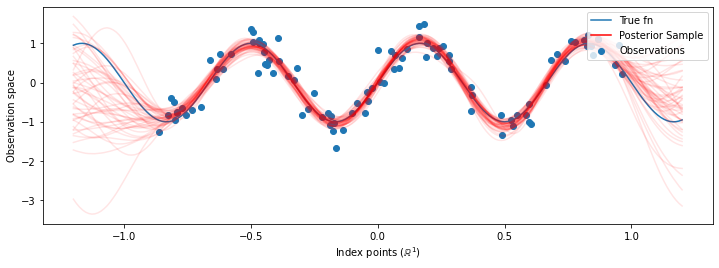
Bây giờ thay vì xây dựng một GP duy nhất với các siêu tối ưu hóa, chúng ta xây dựng phân phối dự đoán sau như một hỗn hợp của các bác sĩ, mỗi xác định bởi một mẫu từ phân phối hậu nghiệm qua siêu tham số. Điều này xấp xỉ tích hợp trên các tham số sau thông qua lấy mẫu Monte Carlo để tính toán phân phối dự đoán cận biên tại các vị trí không được quan sát.
# The sampled hyperparams have a leading batch dimension, `[num_results, ...]`,
# so they construct a *batch* of kernels.
batch_of_posterior_kernels = tfk.ExponentiatedQuadratic(
    amplitude_samples, length_scale_samples)

# The batch of kernels creates a batch of GP predictive models, one for each
# posterior sample.
batch_gprm = tfd.GaussianProcessRegressionModel(
    kernel=batch_of_posterior_kernels,
    index_points=predictive_index_points_,
    observation_index_points=observation_index_points_,
    observations=observations_,
    observation_noise_variance=observation_noise_variance_samples,
    predictive_noise_variance=0.)

# To construct the marginal predictive distribution, we average with uniform
# weight over the posterior samples.
predictive_gprm = tfd.MixtureSameFamily(
    mixture_distribution=tfd.Categorical(logits=tf.zeros([num_results])),
    components_distribution=batch_gprm)

num_samples = 50
samples = predictive_gprm.sample(num_samples)
# Plot the true function, observations, and posterior samples.
plt.figure(figsize=(12, 4))
plt.plot(predictive_index_points_, sinusoid(predictive_index_points_),
         label='True fn')
plt.scatter(observation_index_points_[:, 0], observations_,
            label='Observations')
for i in range(num_samples):
  plt.plot(predictive_index_points_, samples[i, :], c='r', alpha=.1,
           label='Posterior Sample' if i == 0 else None)
leg = plt.legend(loc='upper right')
for lh in leg.legendHandles:
    lh.set_alpha(1)
plt.xlabel(r"Index points ($\mathbb{R}^1$)")
plt.ylabel("Observation space")
plt.show()

Mặc dù sự khác biệt là nhỏ trong trường hợp này, nhưng nói chung, chúng tôi mong đợi phân phối dự đoán sau sẽ khái quát hóa tốt hơn (cho khả năng bị loại bỏ dữ liệu cao hơn) thay vì chỉ sử dụng các tham số có nhiều khả năng nhất như chúng tôi đã làm ở trên.
