 TensorFlow.org에서 보기 TensorFlow.org에서 보기 |  Google Colab에서 실행 Google Colab에서 실행 |  GitHub에서 소스 보기 GitHub에서 소스 보기 |  노트북 다운로드 노트북 다운로드 |
이 colab에서는 TensorFlow 및 TensorFlow Probability를 사용하여 가우스 프로세스 회귀를 탐색합니다. 우리는 일부 알려진 기능에서 일부 잡음이 있는 관찰을 생성하고 해당 데이터에 GP 모델을 맞춥니다. 그런 다음 GP 사후에서 샘플링하고 해당 도메인의 그리드에 샘플링된 함수 값을 플로팅합니다.
배경
하자 \(\mathcal{X}\) 어떤 설정합니다. 가우시안 프로세스 (GP)는 인덱스에 의해 랜덤 변수들의 집합이다 \(\mathcal{X}\) 이러한 경우 것을\(\{X_1, \ldots, X_n\} \subset \mathcal{X}\) 임의의 유한 집합이며, 한계 농도\(p(X_1 = x_1, \ldots, X_n = x_n)\) 다변량 가우시안. 모든 가우스 분포는 첫 번째 및 두 번째 중심 모멘트(평균 및 공분산)에 의해 완전히 지정되며 GP도 예외는 아닙니다. 우리는 평균 기능면에서 완전히 GP를 지정할 수 있습니다 \(\mu : \mathcal{X} \to \mathbb{R}\) 및 공분산 함수\(k : \mathcal{X} \times \mathcal{X} \to \mathbb{R}\). GP의 표현력의 대부분은 공분산 함수의 선택에 캡슐화됩니다. 여러 가지 이유를 들어, 공분산 함수는 커널 함수라고합니다. 단지 (참조 대칭 및 포지티브 확실한 것이 요구된다 채널. 라스무센 & 윌리엄스의 4 ). 아래에서는 ExponentiatedQuadratic 공분산 커널을 사용합니다. 그 형태는
\[ k(x, x') := \sigma^2 \exp \left( \frac{\|x - x'\|^2}{\lambda^2} \right) \]
여기서 \(\sigma^2\) '크기'를 호출 \(\lambda\) 길이 스케일. 커널 매개변수는 최대 가능성 최적화 절차를 통해 선택할 수 있습니다.
GP에서 전체 샘플은 전체 공간을 통해 실수 기능을 포함\(\mathcal{X}\) 및 실현 비현실적 연습이다; 종종 샘플을 관찰할 점 집합을 선택하고 이 점에서 함수 값을 그립니다. 이것은 적절한(유한 차원) 다변수 가우스에서 샘플링하여 달성됩니다.
위의 정의에 따르면 모든 유한 차원 다변수 가우스 분포도 가우스 과정입니다. 하나는 GP를 참조하는 경우 인덱스 세트가 어떤 것을 일반적으로, 그것은 암시입니다 \(\mathbb{R}^n\)우리가 실제로 여기에이 가정을 만들 것입니다.
기계 학습에서 가우스 프로세스의 일반적인 적용은 가우스 프로세스 회귀입니다. 아이디어는 우리가 주어진 잡음이 관찰 알 수없는 함수를 추정하고자하는 것입니다 \(\{y_1, \ldots, y_N\}\) 점의 유한 수의 기능을 \(\{x_1, \ldots x_N\}.\) 우리는 생식 과정을 상상
\[ \begin{align} f \sim \: & \textsf{GaussianProcess}\left( \text{mean_fn}=\mu(x), \text{covariance_fn}=k(x, x')\right) \\ y_i \sim \: & \textsf{Normal}\left( \text{loc}=f(x_i), \text{scale}=\sigma\right), i = 1, \ldots, N \end{align} \]
위에서 언급했듯이 샘플링된 함수는 무한한 수의 포인트에서 값이 필요하기 때문에 계산이 불가능합니다. 대신, 다변수 가우시안의 유한 샘플을 고려합니다.
\[ \begin{gather} \begin{bmatrix} f(x_1) \\ \vdots \\ f(x_N) \end{bmatrix} \sim \textsf{MultivariateNormal} \left( \: \text{loc}= \begin{bmatrix} \mu(x_1) \\ \vdots \\ \mu(x_N) \end{bmatrix} \:,\: \text{scale}= \begin{bmatrix} k(x_1, x_1) & \cdots & k(x_1, x_N) \\ \vdots & \ddots & \vdots \\ k(x_N, x_1) & \cdots & k(x_N, x_N) \\ \end{bmatrix}^{1/2} \: \right) \end{gather} \\ y_i \sim \textsf{Normal} \left( \text{loc}=f(x_i), \text{scale}=\sigma \right) \]
지수 참고 \(\frac{1}{2}\) 공분산 행렬을이는 촐레 스키 분해를 나타낸다. MVN은 위치 규모 가족 분포이기 때문에 Cholesky를 계산하는 것이 필요합니다. 불행하게도 콜레 분해 복용, 계산 비용 \(O(N^3)\) 시간과 \(O(N^2)\) 공간. 대부분의 GP 문헌은 이 겉보기에 무해한 작은 지수를 다루는 데 중점을 두고 있습니다.
사전 평균 함수를 상수(종종 0)로 취하는 것이 일반적입니다. 또한 일부 표기법이 편리합니다. 하나는 자주 쓰는 \(\mathbf{f}\) 샘플링 함수 값의 유한 벡터. 흥미로운 표기 다수의 적용에 기인하는 공분산 행렬에 사용 \(k\) 입력 쌍. 다음 (칸델라 Quiñonero-2005) , 우리는 매트릭스의 구성 요소는 특정 입력 점의 함수 값 공분산 참고. 이와 같이, 우리는 공분산 행렬을 나타낼 수 \(K_{AB}\)여기서 \(A\) 및 \(B\) 주어진 행렬의 크기에 따라 함수 값들의 집합의 일부가 표시된다.
예를 들어, 소정의 관측 데이터 \((\mathbf{x}, \mathbf{y})\) 암시 잠상 함수 값이 \(\mathbf{f}\)우리가 쓸 수
\[ K_{\mathbf{f},\mathbf{f} } = \begin{bmatrix} k(x_1, x_1) & \cdots & k(x_1, x_N) \\ \vdots & \ddots & \vdots \\ k(x_N, x_1) & \cdots & k(x_N, x_N) \\ \end{bmatrix} \]
유사하게, 다음과 같이 입력 세트를 혼합할 수 있습니다.
\[ K_{\mathbf{f},*} = \begin{bmatrix} k(x_1, x^*_1) & \cdots & k(x_1, x^*_T) \\ \vdots & \ddots & \vdots \\ k(x_N, x^*_1) & \cdots & k(x_N, x^*_T) \\ \end{bmatrix} \]
우리가 가정 곳이 있습니다 \(N\) 훈련 입력 및 \(T\) 테스트 입력. 위의 생성 프로세스는 다음과 같이 간결하게 작성할 수 있습니다.
\[ \begin{align} \mathbf{f} \sim \: & \textsf{MultivariateNormal} \left( \text{loc}=\mathbf{0}, \text{scale}=K_{\mathbf{f},\mathbf{f} }^{1/2} \right) \\ y_i \sim \: & \textsf{Normal} \left( \text{loc}=f_i, \text{scale}=\sigma \right), i = 1, \ldots, N \end{align} \]
첫번째 라인의 샘플링 동작은 한정된 세트 산출 \(N\) GP를 상기 그릴 표기법으로서 기능하지 전체 - 다변량 가우시안 함수의 값. 두번째 라인의 집합을 설명 \(N\) 변량 가우시안 함수는 다양한 값에 중심에서 고정 관측 잡음으로 끌어 \(\sigma^2\).
위의 생성 모델을 사용하여 사후 추론 문제를 고려할 수 있습니다. 이것은 위의 프로세스에서 관찰된 노이즈 데이터에 따라 조건이 지정된 새로운 테스트 포인트 세트에서 함수 값에 대한 사후 분포를 생성합니다.
대신 위의 표기법, 우리는 컴팩트 미래를 통해 사후 예측 분포를 쓸 수 있습니다 (잡음) 관찰 (자세한 내용은,의 §2.2 참조 다음과 같이 입력 및 교육 자료를 해당 페이지의 조건부 라스무센 & 윌리엄스 ).
\[ \mathbf{y}^* \mid \mathbf{x}^*, \mathbf{x}, \mathbf{y} \sim \textsf{Normal} \left( \text{loc}=\mathbf{\mu}^*, \text{scale}=(\Sigma^*)^{1/2} \right), \]
어디
\[ \mathbf{\mu}^* = K_{*,\mathbf{f} }\left(K_{\mathbf{f},\mathbf{f} } + \sigma^2 I \right)^{-1} \mathbf{y} \]
그리고
\[ \Sigma^* = K_{*,*} - K_{*,\mathbf{f} } \left(K_{\mathbf{f},\mathbf{f} } + \sigma^2 I \right)^{-1} K_{\mathbf{f},*} \]
수입품
import time

import numpy as np
import matplotlib.pyplot as plt
import tensorflow.compat.v2 as tf
import tensorflow_probability as tfp
tfb = tfp.bijectors
tfd = tfp.distributions
tfk = tfp.math.psd_kernels
tf.enable_v2_behavior()

from mpl_toolkits.mplot3d import Axes3D
%pylab inline
# Configure plot defaults
plt.rcParams['axes.facecolor'] = 'white'
plt.rcParams['grid.color'] = '#666666'
%config InlineBackend.figure_format = 'png'
Populating the interactive namespace from numpy and matplotlib
예: 잡음이 있는 정현파 데이터에 대한 정확한 GP 회귀
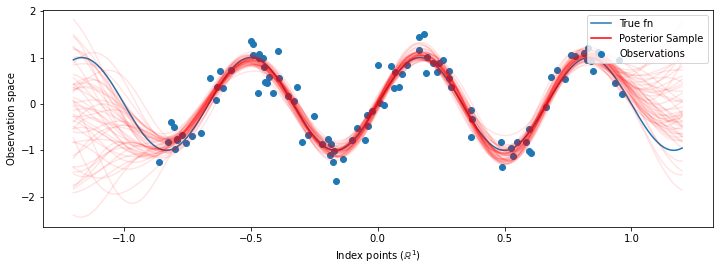
여기에서 잡음이 있는 정현파에서 훈련 데이터를 생성한 다음 GP 회귀 모델의 사후에서 많은 곡선을 샘플링합니다. 우리는 사용 아담 (우리가 이전에 아래에있는 데이터의 부정적인 로그 가능성을 최소화) 커널 하이퍼 파라미터를 최적화 할 수 있습니다. 실제 함수와 사후 샘플이 뒤따르는 훈련 곡선을 플로팅합니다.
def sinusoid(x):
  return np.sin(3 * np.pi * x[..., 0])

def generate_1d_data(num_training_points, observation_noise_variance):
  """Generate noisy sinusoidal observations at a random set of points.

  Returns:
     observation_index_points, observations
  """
  index_points_ = np.random.uniform(-1., 1., (num_training_points, 1))
  index_points_ = index_points_.astype(np.float64)
  # y = f(x) + noise
  observations_ = (sinusoid(index_points_) +
                   np.random.normal(loc=0,
                                    scale=np.sqrt(observation_noise_variance),
                                    size=(num_training_points)))
  return index_points_, observations_
# Generate training data with a known noise level (we'll later try to recover
# this value from the data).
NUM_TRAINING_POINTS = 100
observation_index_points_, observations_ = generate_1d_data(
    num_training_points=NUM_TRAINING_POINTS,
    observation_noise_variance=.1)
우리는 커널 하이퍼 파라미터에 전과를 넣어 사용하는 하이퍼 파라미터 및 관측 데이터의 공동 분배 쓸 것이다 tfd.JointDistributionNamed .
def build_gp(amplitude, length_scale, observation_noise_variance):
  """Defines the conditional dist. of GP outputs, given kernel parameters."""

  # Create the covariance kernel, which will be shared between the prior (which we
  # use for maximum likelihood training) and the posterior (which we use for
  # posterior predictive sampling)
  kernel = tfk.ExponentiatedQuadratic(amplitude, length_scale)

  # Create the GP prior distribution, which we will use to train the model
  # parameters.
  return tfd.GaussianProcess(
      kernel=kernel,
      index_points=observation_index_points_,
      observation_noise_variance=observation_noise_variance)

gp_joint_model = tfd.JointDistributionNamed({
    'amplitude': tfd.LogNormal(loc=0., scale=np.float64(1.)),
    'length_scale': tfd.LogNormal(loc=0., scale=np.float64(1.)),
    'observation_noise_variance': tfd.LogNormal(loc=0., scale=np.float64(1.)),
    'observations': build_gp,
})
우리는 이전에서 샘플링하고 샘플의 로그 밀도를 계산할 수 있는지 확인하여 구현을 온전한 상태로 확인할 수 있습니다.
x = gp_joint_model.sample()
lp = gp_joint_model.log_prob(x)

print("sampled {}".format(x))
print("log_prob of sample: {}".format(lp))
sampled {'observation_noise_variance': <tf.Tensor: shape=(), dtype=float64, numpy=2.067952217184325>, 'length_scale': <tf.Tensor: shape=(), dtype=float64, numpy=1.154435715487831>, 'amplitude': <tf.Tensor: shape=(), dtype=float64, numpy=5.383850737703549>, 'observations': <tf.Tensor: shape=(100,), dtype=float64, numpy=
array([-2.37070577, -2.05363838, -0.95152824,  3.73509388, -0.2912646 ,
        0.46112342, -1.98018513, -2.10295857, -1.33589756, -2.23027226,
       -2.25081374, -0.89450835, -2.54196452,  1.46621647,  2.32016193,
        5.82399989,  2.27241034, -0.67523432, -1.89150197, -1.39834474,
       -2.33954116,  0.7785609 , -1.42763627, -0.57389025, -0.18226098,
       -3.45098732,  0.27986652, -3.64532398, -1.28635204, -2.42362875,
        0.01107288, -2.53222176, -2.0886136 , -5.54047694, -2.18389607,
       -1.11665628, -3.07161217, -2.06070336, -0.84464262,  1.29238438,
       -0.64973999, -2.63805504, -3.93317576,  0.65546645,  2.24721181,
       -0.73403676,  5.31628298, -1.2208384 ,  4.77782252, -1.42978168,
       -3.3089274 ,  3.25370494,  3.02117591, -1.54862932, -1.07360811,
        1.2004856 , -4.3017773 , -4.95787789, -1.95245901, -2.15960839,
       -3.78592731, -1.74096185,  3.54891595,  0.56294143,  1.15288455,
       -0.77323696,  2.34430694, -1.05302007, -0.7514684 , -0.98321063,
       -3.01300144, -3.00033274,  0.44200837,  0.45060886, -1.84497318,
       -1.89616746, -2.15647664, -2.65672581, -3.65493379,  1.70923375,
       -3.88695218, -0.05151283,  4.51906677, -2.28117003,  3.03032793,
       -1.47713194, -0.35625273,  3.73501587, -2.09328047, -0.60665614,
       -0.78177188, -0.67298545,  2.97436033, -0.29407932,  2.98482427,
       -1.54951178,  2.79206821,  4.2225733 ,  2.56265198,  2.80373284])>}
log_prob of sample: -194.96442183797524
이제 사후 확률이 가장 높은 매개변수 값을 찾기 위해 최적화해 보겠습니다. 각 매개변수에 대한 변수를 정의하고 해당 값을 양수로 제한합니다.
# Create the trainable model parameters, which we'll subsequently optimize.
# Note that we constrain them to be strictly positive.

constrain_positive = tfb.Shift(np.finfo(np.float64).tiny)(tfb.Exp())

amplitude_var = tfp.util.TransformedVariable(
    initial_value=1.,
    bijector=constrain_positive,
    name='amplitude',
    dtype=np.float64)

length_scale_var = tfp.util.TransformedVariable(
    initial_value=1.,
    bijector=constrain_positive,
    name='length_scale',
    dtype=np.float64)

observation_noise_variance_var = tfp.util.TransformedVariable(
    initial_value=1.,
    bijector=constrain_positive,
    name='observation_noise_variance_var',
    dtype=np.float64)

trainable_variables = [v.trainable_variables[0] for v in
                       [amplitude_var,
                       length_scale_var,
                       observation_noise_variance_var]]
우리의 관측 데이터에 대한 모델을 상태로, 우리는 정의 할 것이다 target_log_prob (정지 영상 추정되는) 커널 하이퍼 파라미터를 취 기능을.
def target_log_prob(amplitude, length_scale, observation_noise_variance):
  return gp_joint_model.log_prob({
      'amplitude': amplitude,
      'length_scale': length_scale,
      'observation_noise_variance': observation_noise_variance,
      'observations': observations_
  })
# Now we optimize the model parameters.
num_iters = 1000
optimizer = tf.optimizers.Adam(learning_rate=.01)

# Use `tf.function` to trace the loss for more efficient evaluation.
@tf.function(autograph=False, jit_compile=False)
def train_model():
  with tf.GradientTape() as tape:
    loss = -target_log_prob(amplitude_var, length_scale_var,
                            observation_noise_variance_var)
  grads = tape.gradient(loss, trainable_variables)
  optimizer.apply_gradients(zip(grads, trainable_variables))
  return loss

# Store the likelihood values during training, so we can plot the progress
lls_ = np.zeros(num_iters, np.float64)
for i in range(num_iters):
  loss = train_model()
  lls_[i] = loss

print('Trained parameters:')
print('amplitude: {}'.format(amplitude_var._value().numpy()))
print('length_scale: {}'.format(length_scale_var._value().numpy()))
print('observation_noise_variance: {}'.format(observation_noise_variance_var._value().numpy()))
Trained parameters:
amplitude: 0.9176153445125278
length_scale: 0.18444082442910079
observation_noise_variance: 0.0880273312850989
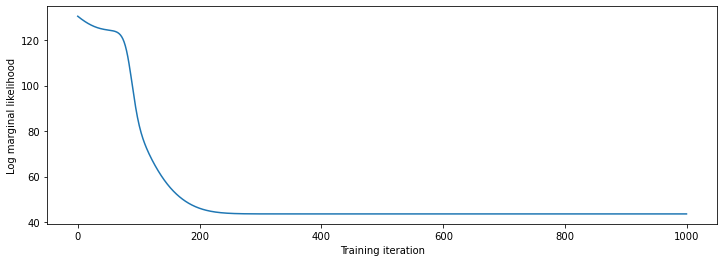
# Plot the loss evolution
plt.figure(figsize=(12, 4))
plt.plot(lls_)
plt.xlabel("Training iteration")
plt.ylabel("Log marginal likelihood")
plt.show()

# Having trained the model, we'd like to sample from the posterior conditioned
# on observations. We'd like the samples to be at points other than the training
# inputs.
predictive_index_points_ = np.linspace(-1.2, 1.2, 200, dtype=np.float64)
# Reshape to [200, 1] -- 1 is the dimensionality of the feature space.
predictive_index_points_ = predictive_index_points_[..., np.newaxis]

optimized_kernel = tfk.ExponentiatedQuadratic(amplitude_var, length_scale_var)
gprm = tfd.GaussianProcessRegressionModel(
    kernel=optimized_kernel,
    index_points=predictive_index_points_,
    observation_index_points=observation_index_points_,
    observations=observations_,
    observation_noise_variance=observation_noise_variance_var,
    predictive_noise_variance=0.)

# Create op to draw  50 independent samples, each of which is a *joint* draw
# from the posterior at the predictive_index_points_. Since we have 200 input
# locations as defined above, this posterior distribution over corresponding
# function values is a 200-dimensional multivariate Gaussian distribution!
num_samples = 50
samples = gprm.sample(num_samples)
# Plot the true function, observations, and posterior samples.
plt.figure(figsize=(12, 4))
plt.plot(predictive_index_points_, sinusoid(predictive_index_points_),
         label='True fn')
plt.scatter(observation_index_points_[:, 0], observations_,
            label='Observations')
for i in range(num_samples):
  plt.plot(predictive_index_points_, samples[i, :], c='r', alpha=.1,
           label='Posterior Sample' if i == 0 else None)
leg = plt.legend(loc='upper right')
for lh in leg.legendHandles:
    lh.set_alpha(1)
plt.xlabel(r"Index points ($\mathbb{R}^1$)")
plt.ylabel("Observation space")
plt.show()

HMC로 하이퍼파라미터 주변화
하이퍼파라미터를 최적화하는 대신 Hamiltonian Monte Carlo와 통합해 보겠습니다. 관찰이 주어지면 커널 하이퍼파라미터에 대한 사후 분포에서 대략적으로 도출하기 위해 먼저 샘플러를 정의하고 실행할 것입니다.
num_results = 100
num_burnin_steps = 50

sampler = tfp.mcmc.TransformedTransitionKernel(
    tfp.mcmc.NoUTurnSampler(
        target_log_prob_fn=target_log_prob,
        step_size=tf.cast(0.1, tf.float64)),
    bijector=[constrain_positive, constrain_positive, constrain_positive])

adaptive_sampler = tfp.mcmc.DualAveragingStepSizeAdaptation(
    inner_kernel=sampler,
    num_adaptation_steps=int(0.8 * num_burnin_steps),
    target_accept_prob=tf.cast(0.75, tf.float64))

initial_state = [tf.cast(x, tf.float64) for x in [1., 1., 1.]]
# Speed up sampling by tracing with `tf.function`.
@tf.function(autograph=False, jit_compile=False)
def do_sampling():
  return tfp.mcmc.sample_chain(
      kernel=adaptive_sampler,
      current_state=initial_state,
      num_results=num_results,
      num_burnin_steps=num_burnin_steps,
      trace_fn=lambda current_state, kernel_results: kernel_results)

t0 = time.time()
samples, kernel_results = do_sampling()
t1 = time.time()
print("Inference ran in {:.2f}s.".format(t1-t0))
Inference ran in 9.00s.
하이퍼파라미터 추적을 검사하여 샘플러를 온전한 상태로 확인합시다.
(amplitude_samples,
 length_scale_samples,
 observation_noise_variance_samples) = samples

f = plt.figure(figsize=[15, 3])
for i, s in enumerate(samples):
  ax = f.add_subplot(1, len(samples) + 1, i + 1)
  ax.plot(s)

지금 대신 하이퍼 파라미터 최적화 단일 GP를 구성하는 우리의 GPS의 혼합물, 하이퍼 파라미터 통해 사후 분포로부터 시료에 의해 정의 된 각 같이 후방 예측 분포를 생성. 이것은 관찰되지 않은 위치에서 주변 예측 분포를 계산하기 위해 Monte Carlo 샘플링을 통해 사후 매개변수에 대해 대략적으로 통합됩니다.
# The sampled hyperparams have a leading batch dimension, `[num_results, ...]`,
# so they construct a *batch* of kernels.
batch_of_posterior_kernels = tfk.ExponentiatedQuadratic(
    amplitude_samples, length_scale_samples)

# The batch of kernels creates a batch of GP predictive models, one for each
# posterior sample.
batch_gprm = tfd.GaussianProcessRegressionModel(
    kernel=batch_of_posterior_kernels,
    index_points=predictive_index_points_,
    observation_index_points=observation_index_points_,
    observations=observations_,
    observation_noise_variance=observation_noise_variance_samples,
    predictive_noise_variance=0.)

# To construct the marginal predictive distribution, we average with uniform
# weight over the posterior samples.
predictive_gprm = tfd.MixtureSameFamily(
    mixture_distribution=tfd.Categorical(logits=tf.zeros([num_results])),
    components_distribution=batch_gprm)

num_samples = 50
samples = predictive_gprm.sample(num_samples)
# Plot the true function, observations, and posterior samples.
plt.figure(figsize=(12, 4))
plt.plot(predictive_index_points_, sinusoid(predictive_index_points_),
         label='True fn')
plt.scatter(observation_index_points_[:, 0], observations_,
            label='Observations')
for i in range(num_samples):
  plt.plot(predictive_index_points_, samples[i, :], c='r', alpha=.1,
           label='Posterior Sample' if i == 0 else None)
leg = plt.legend(loc='upper right')
for lh in leg.legendHandles:
    lh.set_alpha(1)
plt.xlabel(r"Index points ($\mathbb{R}^1$)")
plt.ylabel("Observation space")
plt.show()

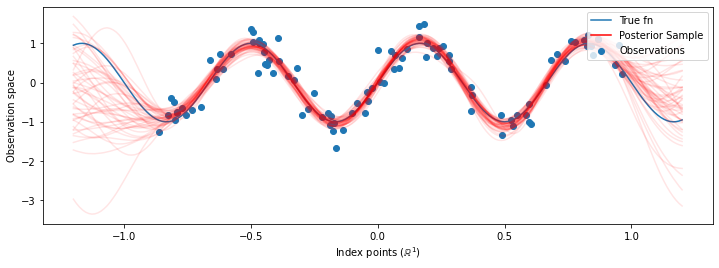
이 경우 차이는 미묘하지만 일반적으로 위에서 했던 것처럼 가장 가능성이 높은 매개변수를 사용하는 것보다 사후 예측 분포가 더 잘 일반화될 것으로 예상합니다(유지된 데이터에 더 높은 가능성 제공).
