 ดูบน TensorFlow.org ดูบน TensorFlow.org |  ทำงานใน Google Colab ทำงานใน Google Colab |  ดูแหล่งที่มาบน GitHub ดูแหล่งที่มาบน GitHub |  ดาวน์โหลดโน๊ตบุ๊ค ดาวน์โหลดโน๊ตบุ๊ค |
โมเดลตัวแปรแฝงพยายามจับโครงสร้างที่ซ่อนอยู่ในข้อมูลมิติสูง ตัวอย่าง ได้แก่ การวิเคราะห์องค์ประกอบหลัก (PCA) และการวิเคราะห์ปัจจัย กระบวนการเกาส์เซียนเป็นแบบจำลอง "ไม่มีพารามิเตอร์" ซึ่งสามารถจับโครงสร้างสหสัมพันธ์และความไม่แน่นอนในท้องถิ่นได้อย่างยืดหยุ่น กระบวนการ Gaussian รูปแบบตัวแปรแฝง ( อเรนซ์ 2004 ) รวมแนวคิดเหล่านี้
ความเป็นมา: กระบวนการเกาส์เซียน
กระบวนการแบบเกาส์เซียนคือชุดของตัวแปรสุ่มใดๆ ก็ตาม โดยที่การแจกแจงส่วนเพิ่มในส่วนย่อยที่มีขอบเขตจำกัดเป็นการแจกแจงแบบปกติหลายตัวแปร สำหรับดูรายละเอียดที่จีพีเอสในบริบทของการถดถอยให้ตรวจสอบ Gaussian ถดถอยกระบวนการใน TensorFlow ความน่าจะเป็น
เราใช้สิ่งที่เรียกว่า SET Index จะติดป้ายแต่ละตัวแปรสุ่มในคอลเลกชันที่ประกอบด้วยจีพี ในกรณีของชุดดัชนีจำกัด เราก็แค่หาค่าปกติหลายตัวแปร GP เป็นที่น่าสนใจมากที่สุด แต่เมื่อเราพิจารณาคอลเลกชันที่ไม่มีที่สิ้นสุด ในกรณีที่ชุดดัชนีเช่น \(\mathbb{R}^D\)ที่เรามีตัวแปรสุ่มสำหรับจุดในทุก \(D\)พื้นที่มิติ, GP สามารถจะคิดว่าเป็นฟังก์ชั่นการกระจายมากกว่าสุ่ม วาดเดียวจาก GP เช่นถ้ามันเกิดขึ้นจริงจะกำหนด (ร่วมได้ตามปกติกระจาย) มูลค่าให้กับจุดในทุก \(\mathbb{R}^D\)ใน Colab นี้เราจะมุ่งเน้นไปที่ GP กว่าบาง\(\mathbb{R}^D\)
การแจกแจงแบบปกติถูกกำหนดโดยสถิติของลำดับที่หนึ่งและสอง - อันที่จริง วิธีหนึ่งในการนิยามการแจกแจงแบบปกติคือการที่การแจกแจงลำดับที่สูงกว่านั้นเป็นศูนย์ทั้งหมด เป็นกรณีนี้สำหรับ GP ของเกินไป: เราสมบูรณ์ระบุ GP โดยการอธิบายความหมายและความแปรปรวน * จำไว้ว่าสำหรับค่าปกติหลายตัวแปรที่มีจำกัด ค่าเฉลี่ยคือเวกเตอร์ และความแปรปรวนร่วมคือเมทริกซ์ค่าคงที่บวกกำลังสองที่สมมาตร ในมิติอนันต์ GP โครงสร้างเหล่านี้คุยกับฟังก์ชั่นเฉลี่ย \(m : \mathbb{R}^D \to \mathbb{R}\)ที่กำหนดไว้ที่จุดของ SET Index ในแต่ละและความแปรปรวน kernel "ฟังก์ชัน"\(k : \mathbb{R}^D \times \mathbb{R}^D \to \mathbb{R}\)ฟังก์ชั่นเคอร์เนลจะต้อง บวกที่ชัดเจน ซึ่งเป็นหลักกล่าวว่า จำกัด ให้ขอบเขตของจุดก็มีผลเป็นเมทริกซ์ postiive-แน่นอน
โครงสร้างส่วนใหญ่ของ GP เกิดขึ้นจากฟังก์ชันเคอร์เนลความแปรปรวนร่วม - ฟังก์ชันนี้จะอธิบายว่าค่าของฟังก์ชัน sampeld แตกต่างกันอย่างไรในจุดใกล้เคียง (หรือไม่ใกล้เคียงกัน) ฟังก์ชันความแปรปรวนร่วมที่แตกต่างกันจะส่งเสริมระดับความเรียบเนียนที่แตกต่างกัน หนึ่งฟังก์ชันเคอร์เนลที่ใช้กันทั่วไปคือ "exponentiated กำลังสอง" (aka "เกาส์", "ยืดชี้แจง" หรือ "ฟังก์ชั่นพื้นฐานรัศมี") \(k(x, x') = \sigma^2 e^{(x - x^2) / \lambda^2}\)ตัวอย่างอื่น ๆ ที่ระบุไว้ในเดวิด Duvenaud ของ หน้าเคอร์เนลตำรา เช่นเดียวกับในข้อความที่ยอมรับ Gaussian กระบวนการเครื่องการเรียนรู้
* ด้วยชุดดัชนีอนันต์ เรายังต้องการเงื่อนไขความสอดคล้องกัน เนื่องจากคำจำกัดความของ GP อยู่ในเงื่อนไขของ marginals ที่จำกัด เราจึงต้องกำหนดให้ marginals เหล่านี้สอดคล้องกันโดยไม่คำนึงถึงลำดับของ marginals ที่ถูกนำไปใช้ นี่เป็นหัวข้อที่ค่อนข้างสูงในทฤษฎีของกระบวนการสุ่ม ซึ่งอยู่นอกขอบเขตสำหรับบทช่วยสอนนี้ พอเพียงที่จะบอกว่าสิ่งต่าง ๆ ออกมาดีในที่สุด!
การใช้ GPs: แบบจำลองการถดถอยและตัวแปรแฝง
วิธีหนึ่งที่เราสามารถใช้จีพีเอสสำหรับการถดถอย: รับพวงของข้อมูลที่สังเกตได้ในรูปแบบของปัจจัยการผลิตที่ \(\{x_i\}_{i=1}^N\) (องค์ประกอบของ SET Index) และการสังเกต\(\{y_i\}_{i=1}^N\)เราสามารถใช้เหล่านี้จะก่อให้เกิดการกระจายการทำนายหลังที่ใหม่ ชุดของจุด \(\{x_j^*\}_{j=1}^M\)ตั้งแต่การกระจายที่มี Gaussian ทั้งหมดนี้เดือดลงไปบางพีชคณิตเชิงเส้นตรงไปตรงมา ( แต่หมายเหตุ: การคำนวณจำเป็นต้องรันไทม์ลูกบาศก์ในจำนวนของจุดข้อมูลและต้องใช้กำลังสองพื้นที่ในจำนวนของจุดข้อมูล - นี้เป็นปัจจัยสำคัญในการ การใช้ GPs และการวิจัยในปัจจุบันจำนวนมากมุ่งเน้นไปที่ทางเลือกที่สามารถคำนวณได้สำหรับการอนุมานหลังที่แน่นอน) เราครอบคลุม GP ถดถอยในรายละเอียดมากขึ้นใน GP ถดถอยใน TFP Colab
อีกวิธีหนึ่งที่เราสามารถใช้ GPs ได้คือเป็นแบบจำลองตัวแปรแฝง: เมื่อพิจารณาจากชุดการสังเกตที่มีมิติสูง (เช่น รูปภาพ) เราสามารถวางโครงสร้างบางส่วนที่ซ่อนเร้นมิติต่ำได้ เราคิดว่าตามเงื่อนไขในโครงสร้างแฝง จำนวนเอาต์พุต (พิกเซลในภาพ) จำนวนมากไม่ขึ้นต่อกัน การอบรมในรูปแบบนี้ประกอบด้วย
- การปรับพารามิเตอร์โมเดลให้เหมาะสม (พารามิเตอร์ฟังก์ชันเคอร์เนล เช่นเดียวกับ เช่น ความแปรปรวนของสัญญาณรบกวนจากการสังเกต) และ
- การค้นหา สำหรับการสังเกตการฝึกอบรมแต่ละครั้ง (ภาพ) ตำแหน่งจุดที่สอดคล้องกันในชุดดัชนี การเพิ่มประสิทธิภาพทั้งหมดสามารถทำได้โดยเพิ่มโอกาสในการบันทึกส่วนเพิ่มของข้อมูลให้สูงสุด
นำเข้า
import numpy as np
import tensorflow.compat.v2 as tf
tf.enable_v2_behavior()
import tensorflow_probability as tfp
tfd = tfp.distributions
tfk = tfp.math.psd_kernels
%pylab inline
Populating the interactive namespace from numpy and matplotlib
โหลด MNIST Data
# Load the MNIST data set and isolate a subset of it.
(x_train, y_train), (_, _) = tf.keras.datasets.mnist.load_data()
N = 1000
small_x_train = x_train[:N, ...].astype(np.float64) / 256.
small_y_train = y_train[:N]
Downloading data from https://storage.googleapis.com/tensorflow/tf-keras-datasets/mnist.npz
11493376/11490434 [==============================] - 0s 0us/step
11501568/11490434 [==============================] - 0s 0us/step
เตรียมตัวแปรที่สามารถฝึกได้
เราจะร่วมกันฝึกอบรมพารามิเตอร์แบบจำลอง 3 แบบรวมถึงอินพุตแฝง
# Create some trainable model parameters. We will constrain them to be strictly
# positive when constructing the kernel and the GP.
unconstrained_amplitude = tf.Variable(np.float64(1.), name='amplitude')
unconstrained_length_scale = tf.Variable(np.float64(1.), name='length_scale')
unconstrained_observation_noise = tf.Variable(np.float64(1.), name='observation_noise')
# We need to flatten the images and, somewhat unintuitively, transpose from
# shape [100, 784] to [784, 100]. This is because the 784 pixels will be
# treated as *independent* conditioned on the latent inputs, meaning we really
# have a batch of 784 GP's with 100 index_points.
observations_ = small_x_train.reshape(N, -1).transpose()

# Create a collection of N 2-dimensional index points that will represent our
# latent embeddings of the data. (Lawrence, 2004) prescribes initializing these
# with PCA, but a random initialization actually gives not-too-bad results, so
# we use this for simplicity. For a fun exercise, try doing the
# PCA-initialization yourself!
init_ = np.random.normal(size=(N, 2))
latent_index_points = tf.Variable(init_, name='latent_index_points')
สร้างแบบจำลองและปฏิบัติการฝึกหัด
# Create our kernel and GP distribution
EPS = np.finfo(np.float64).eps

def create_kernel():
  amplitude = tf.math.softplus(EPS + unconstrained_amplitude)
  length_scale = tf.math.softplus(EPS + unconstrained_length_scale)
  kernel = tfk.ExponentiatedQuadratic(amplitude, length_scale)
  return kernel

def loss_fn():
  observation_noise_variance = tf.math.softplus(
      EPS + unconstrained_observation_noise)
  gp = tfd.GaussianProcess(
      kernel=create_kernel(),
      index_points=latent_index_points,
      observation_noise_variance=observation_noise_variance)
  log_probs = gp.log_prob(observations_, name='log_prob')
  return -tf.reduce_mean(log_probs)

trainable_variables = [unconstrained_amplitude,
                       unconstrained_length_scale,
                       unconstrained_observation_noise,
                       latent_index_points]

optimizer = tf.optimizers.Adam(learning_rate=1.0)

@tf.function(autograph=False, jit_compile=True)
def train_model():
  with tf.GradientTape() as tape:
    loss_value = loss_fn()
  grads = tape.gradient(loss_value, trainable_variables)
  optimizer.apply_gradients(zip(grads, trainable_variables))
  return loss_value
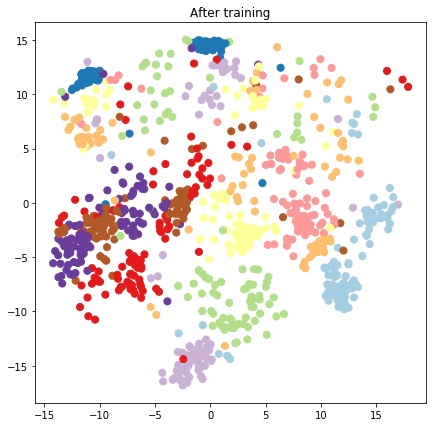
ฝึกและวางแผนการฝังแฝงที่เกิด
# Initialize variables and train!
num_iters = 100
log_interval = 20
lips = np.zeros((num_iters, N, 2), np.float64)
for i in range(num_iters):
  loss = train_model()
  lips[i] = latent_index_points.numpy()
  if i % log_interval == 0 or i + 1 == num_iters:
    print("Loss at step %d: %f" % (i, loss))
Loss at step 0: 1108.121688
Loss at step 20: -159.633761
Loss at step 40: -263.014394
Loss at step 60: -283.713056
Loss at step 80: -288.709413
Loss at step 99: -289.662253
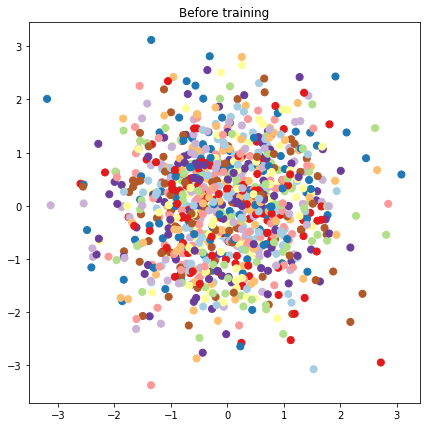
ผลลัพธ์ของพล็อต
# Plot the latent locations before and after training
plt.figure(figsize=(7, 7))
plt.title("Before training")
plt.grid(False)
plt.scatter(x=init_[:, 0], y=init_[:, 1],
           c=y_train[:N], cmap=plt.get_cmap('Paired'), s=50)
plt.show()

plt.figure(figsize=(7, 7))
plt.title("After training")
plt.grid(False)
plt.scatter(x=lips[-1, :, 0], y=lips[-1, :, 1],
           c=y_train[:N], cmap=plt.get_cmap('Paired'), s=50)
plt.show()


สร้างแบบจำลองการคาดการณ์และการสุ่มตัวอย่าง
# We'll draw samples at evenly spaced points on a 10x10 grid in the latent
# input space.
sample_grid_points = 10
grid_ = np.linspace(-4, 4, sample_grid_points).astype(np.float64)
# Create a 10x10 grid of 2-vectors, for a total shape [10, 10, 2]
grid_ = np.stack(np.meshgrid(grid_, grid_), axis=-1)

# This part's a bit subtle! What we defined above was a batch of 784 (=28x28)
# independent GP distributions over the input space. Each one corresponds to a
# single pixel of an MNIST image. Now what we'd like to do is draw 100 (=10x10)
# *independent* samples, each one separately conditioned on all the observations
# as well as the learned latent input locations above.
#
# The GP regression model below will define a batch of 784 independent
# posteriors. We'd like to get 100 independent samples each at a different
# latent index point. We could loop over the points in the grid, but that might
# be a bit slow. Instead, we can vectorize the computation by tacking on *even
# more* batch dimensions to our GaussianProcessRegressionModel distribution.
# In the below grid_ shape, we have concatentaed
#   1. batch shape: [sample_grid_points, sample_grid_points, 1]
#   2. number of examples: [1]
#   3. number of latent input dimensions: [2]
# The `1` in the batch shape will broadcast with 784. The final result will be
# samples of shape [10, 10, 784, 1]. The `1` comes from the "number of examples"
# and we can just `np.squeeze` it off.
grid_ = grid_.reshape(sample_grid_points, sample_grid_points, 1, 1, 2)

# Create the GPRegressionModel instance which represents the posterior
# predictive at the grid of new points.
gprm = tfd.GaussianProcessRegressionModel(
    kernel=create_kernel(),
    # Shape [10, 10, 1, 1, 2]
    index_points=grid_,
    # Shape [1000, 2]. 1000 2 dimensional vectors.
    observation_index_points=latent_index_points,
    # Shape [784, 1000]. A batch of 784 1000-dimensional observations.
    observations=observations_)
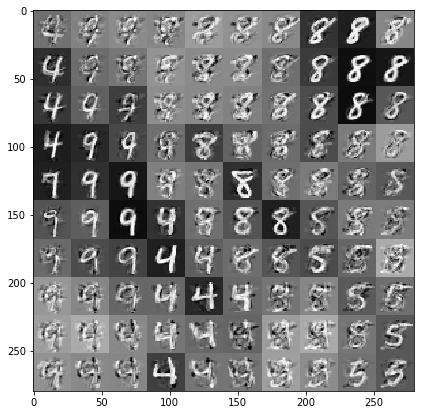
วาดตัวอย่างที่มีเงื่อนไขบนข้อมูลและการฝังแฝง
เราสุ่มตัวอย่างที่ 100 จุดในตาราง 2 มิติในพื้นที่แฝง
samples = gprm.sample()

# Plot the grid of samples at new points. We do a bit of tweaking of the samples
# first, squeezing off extra 1-shapes and normalizing the values.
samples_ = np.squeeze(samples.numpy())
samples_ = ((samples_ -
             samples_.min(-1, keepdims=True)) /
            (samples_.max(-1, keepdims=True) -
             samples_.min(-1, keepdims=True)))
samples_ = samples_.reshape(sample_grid_points, sample_grid_points, 28, 28)
samples_ = samples_.transpose([0, 2, 1, 3])
samples_ = samples_.reshape(28 * sample_grid_points, 28 * sample_grid_points)
plt.figure(figsize=(7, 7))
ax = plt.subplot()
ax.grid(False)
ax.imshow(-samples_, interpolation='none', cmap='Greys')
plt.show()

บทสรุป
เราได้พาชมสั้น ๆ เกี่ยวกับโมเดลตัวแปรแฝงของกระบวนการเกาส์เซียน และแสดงให้เห็นว่าเราสามารถนำไปใช้ได้อย่างไรในโค้ดความน่าจะเป็น TF และ TF เพียงไม่กี่บรรทัด
