 הצג באתר TensorFlow.org הצג באתר TensorFlow.org |  הפעל בגוגל קולאב הפעל בגוגל קולאב |  צפה במקור ב-GitHub צפה במקור ב-GitHub |  הורד מחברת הורד מחברת |
במחברת זו אנו מראים כיצד להשתמש הסתברות TensorFlow (הפריון הכולל) כדי מדגם מתערובת העצרת של חלוקת Gaussians מוגדר:\(p(x_1, ..., x_n) = \prod_i p_i(x_i)\) שם: \(\begin{align*} p_i &\equiv \frac{1}{K}\sum_{k=1}^K \pi_{ik}\,\text{Normal}\left(\text{loc}=\mu_{ik},\, \text{scale}=\sigma_{ik}\right)\\1&=\sum_{k=1}^K\pi_{ik}, \forall i.\hphantom{MMMMMMMMMMM}\end{align*}\)
כל משתנה \(x_i\) הוא הדגם כמו תערובת של Gaussians, ואת ההפצה המשותפת מעל כל \(n\) משתנים הוא תוצר של צפיפות אלה.
בהינתן הנתונים \(x^{(1)}, ..., x^{(T)}\), אנחנו מחקים כל dataponit \(x^{(j)}\) כתערובת העצרת של Gaussians:
\[p(x^{(j)}) = \prod_i p_i (x_i^{(j)})\]
תערובות פקטוריאליות הן דרך פשוטה ליצור הפצות עם מספר קטן של פרמטרים ומספר רב של מצבים.
import tensorflow as tf
import numpy as np
import tensorflow_probability as tfp
import matplotlib.pyplot as plt
import seaborn as sns
tfd = tfp.distributions

# Use try/except so we can easily re-execute the whole notebook.
try:
  tf.enable_eager_execution()
except:
  pass
בנה את התערובת הפקטוריאלית של גאוסים באמצעות TFP
num_vars = 2        # Number of variables (`n` in formula).
var_dim = 1         # Dimensionality of each variable `x[i]`.
num_components = 3  # Number of components for each mixture (`K` in formula).
sigma = 5e-2        # Fixed standard deviation of each component.

# Choose some random (component) modes.
component_mean = tfd.Uniform().sample([num_vars, num_components, var_dim])

factorial_mog = tfd.Independent(
   tfd.MixtureSameFamily(
       # Assume uniform weight on each component.
       mixture_distribution=tfd.Categorical(
           logits=tf.zeros([num_vars, num_components])),
       components_distribution=tfd.MultivariateNormalDiag(
           loc=component_mean, scale_diag=[sigma])),
   reinterpreted_batch_ndims=1)
שימו לב השימוש שלנו tfd.Independent . זה "-הפצת מטא" חלה reduce_sum ב log_prob החישוב רחב הימניים ביותר reinterpreted_batch_ndims הממדים יצוו. במקרה שלנו, הסכומים הזה החוצה המשתנים ממד עוזבים את הממד יצווה רק כאשר אנו מחשבי log_prob . שימו לב שזה לא משפיע על הדגימה.
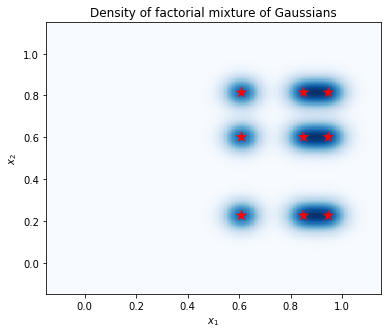
תכנן את הצפיפות
חשב את הצפיפות על רשת של נקודות, והצג את מיקומי המצבים עם כוכבים אדומים. כל מצב בתערובת הפקטוריאלית תואם לזוג מצבים מהתערובת הבסיסית של משתנה אינדיבידואלי של גאוסים. אנחנו יכולים לראות 9 מצבים בעלילה בהמשך, אבל אנחנו רק צורך 6 פרמטרים (3 לציין את המיקומים של המצבים ב \(x_1\), ו 3 כדי לציין את המיקומים של המצבים ב \(x_2\)). לעומת זאת, תערובת של חלוק Gaussians בחלל 2D \((x_1, x_2)\) תדרוש 2 * 9 = 18 פרמטרים כדי לציין 9 המצבים.
plt.figure(figsize=(6,5))

# Compute density.
nx = 250 # Number of bins per dimension.
x = np.linspace(-3 * sigma, 1 + 3 * sigma, nx).astype('float32')
vals = tf.reshape(tf.stack(np.meshgrid(x, x), axis=2), (-1, num_vars, var_dim))
probs = factorial_mog.prob(vals).numpy().reshape(nx, nx)

# Display as image.
from matplotlib.colors import ListedColormap
cmap = ListedColormap(sns.color_palette("Blues", 256))
p = plt.pcolor(x, x, probs, cmap=cmap)
ax = plt.axis('tight');

# Plot locations of means.
means_np = component_mean.numpy().squeeze()
for mu_x in means_np[0]:
  for mu_y in means_np[1]:
    plt.scatter(mu_x, mu_y, s=150, marker='*', c='r', edgecolor='none');
plt.axis(ax);

plt.xlabel('$x_1$')
plt.ylabel('$x_2$')
plt.title('Density of factorial mixture of Gaussians');

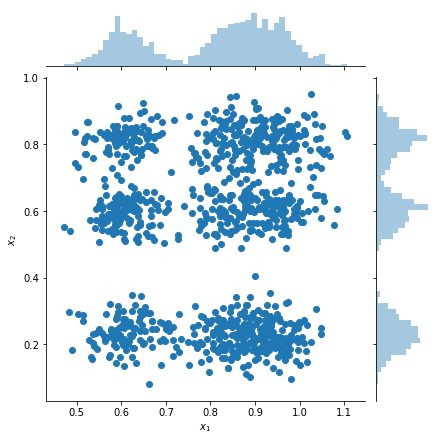
דגימות עלילה והערכות צפיפות שולית
samples = factorial_mog.sample(1000).numpy()

g = sns.jointplot(
    x=samples[:, 0, 0],
    y=samples[:, 1, 0],
    kind="scatter",
    marginal_kws=dict(bins=50))
g.set_axis_labels("$x_1$", "$x_2$");

