 TensorFlow.orgで表示 TensorFlow.orgで表示 |
 Google Colab で実行 Google Colab で実行 |
 GitHub でソースを表示{ GitHub でソースを表示{ |
 ノートブックをダウンロード/a0} ノートブックをダウンロード/a0} |
概要
自動音声認識における大きな課題の 1 つは、音声データの準備と拡張です。音声データ分析は、時間または周波数領域にあり可能性があるため、画像などのほかのデータソースと比べさらに複雑化します。
TensorFlow エコシステムの一環として、tensorflow-io パッケージには、多数の有用な音声関連の API が提供されており、音声データの準備と拡張を単純化することができます。
セットアップ
必要なパッケージをインストールし、ランタイムを再起動する
pip install -q tensorflow-io使用方法
音声ファイルを読み取る
TensorFlow IO では、クラス tfio.audio.AudioIOTensor を使用して、音声ファイルを遅延読み込みされる IOTensor に読み出すことができます。
import tensorflow as tf
import tensorflow_io as tfio

audio = tfio.audio.AudioIOTensor('gs://cloud-samples-tests/speech/brooklyn.flac')

print(audio)
<AudioIOTensor: shape=[28979 1], dtype=<dtype: 'int16'>, rate=16000>
上記の例の Flac ファイル brooklyn.flac は、google cloud でパブリックアクセスが可能な音声クリップから得たものです。
GCS は TensorFlow でサポートされているファイルシステムであるため、GCS アドレス gs://cloud-samples-tests/speech/brooklyn.flac が直接使用されています。Flac 形式のほか、WAV、Ogg、MP3、および MP4A 形式も AudioIOTensor の自動ファイル形式検出でサポートされています。
AudioIOTensor は遅延読み込みされるため、最初は形状、dtype、およびサンプルレートしか表示されません。AudioIOTensor の形状は [samples, channels] で表現され、読み込んだ音声クリップが int16 型の 28979 サンプルを含む Mono チャンネルであることを示します。
音声クリップのコンテンツは、to_tensor() 経由で AudioIOTensor から Tensor に変換するか、スライスによって、必要に応じてのみ読み取られます。スライスは、特に大きな音声クリップのほんの一部のみが必要である場合に役立ちます。
audio_slice = audio[100:]

# remove last dimension
audio_tensor = tf.squeeze(audio_slice, axis=[-1])

print(audio_tensor)
tf.Tensor([16 39 66 ... 56 81 83], shape=(28879,), dtype=int16)
次のようにして、音声を再生できます。
from IPython.display import Audio

Audio(audio_tensor.numpy(), rate=audio.rate.numpy())
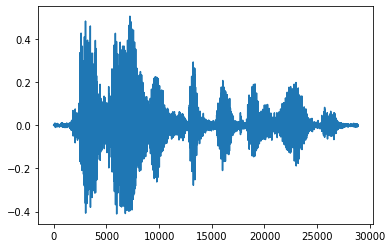
テンソルを浮動小数点数に変換して音声クリップをグラフに表示するとより便利です。
import matplotlib.pyplot as plt


tensor = tf.cast(audio_tensor, tf.float32) / 32768.0

plt.figure()
plt.plot(tensor.numpy())
[<matplotlib.lines.Line2D at 0x7fe8ee00c3c8>]
ノイズをトリムする
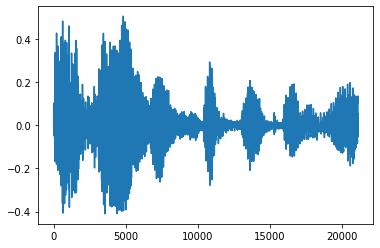
音声からノイズを取り除く方が好ましい場合があります。これは、API tfio.experimental.audio.trim を使用して行います。API から戻されるのは、セグメントの [start, stop] 位置のペアです。
position = tfio.experimental.audio.trim(tensor, axis=0, epsilon=0.1)
print(position)

start = position[0]
stop = position[1]
print(start, stop)

processed = tensor[start:stop]

plt.figure()
plt.plot(processed.numpy())
tf.Tensor([ 2398 23546], shape=(2,), dtype=int64)
tf.Tensor(2398, shape=(), dtype=int64) tf.Tensor(23546, shape=(), dtype=int64)
[<matplotlib.lines.Line2D at 0x7fe8e018c048>]
フェードインとフェードアウト
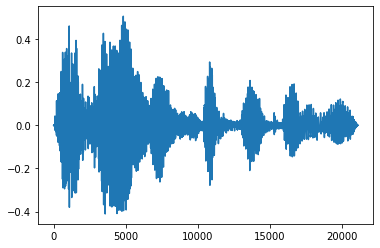
音声エンジニアリングの有用なテクニックには、フェードという、音声信号を徐々に増加または減少させるものがあります。これは、tfio.experimental.audio.fade を使用して行います。tfio.experimental.audio.fade は、linear、logarithmic、または exponential などのさまざまな形状のフェードをサポートしています。
fade = tfio.experimental.audio.fade(
    processed, fade_in=1000, fade_out=2000, mode="logarithmic")

plt.figure()
plt.plot(fade.numpy())
[<matplotlib.lines.Line2D at 0x7fe8e00e5d68>]
スペクトログラム
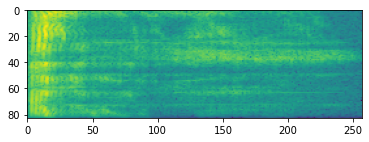
多くの場合、高度な音声処理は、時間の経過に伴う周波数の変化に対応します。tensorflow-io では、tfio.experimental.audio.spectrogram を使って波形を変換することができます。
# Convert to spectrogram
spectrogram = tfio.experimental.audio.spectrogram(
    fade, nfft=512, window=512, stride=256)

plt.figure()
plt.imshow(tf.math.log(spectrogram).numpy())
<matplotlib.image.AxesImage at 0x7fe8e00cbda0>
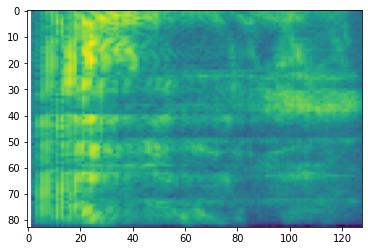
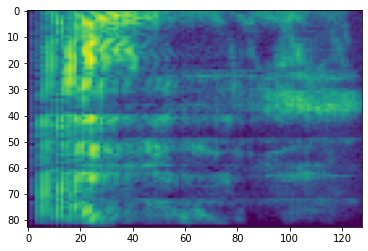
異なるスケールへの追加の変換も可能です。
# Convert to mel-spectrogram
mel_spectrogram = tfio.experimental.audio.melscale(
    spectrogram, rate=16000, mels=128, fmin=0, fmax=8000)


plt.figure()
plt.imshow(tf.math.log(mel_spectrogram).numpy())

# Convert to db scale mel-spectrogram
dbscale_mel_spectrogram = tfio.experimental.audio.dbscale(
    mel_spectrogram, top_db=80)

plt.figure()
plt.imshow(dbscale_mel_spectrogram.numpy())
<matplotlib.image.AxesImage at 0x7fe8ee103ef0>
SpecAugment
上述したデータの準備と拡張 API のほか、tensorflow-io パッケージには、高度なスペクトログラムの拡張、特に SpecAugment: A Simple Data Augmentation Method for Automatic Speech Recognition(Park et al., 2019)で論じられている周波数と時間のマスキングも含まれています。
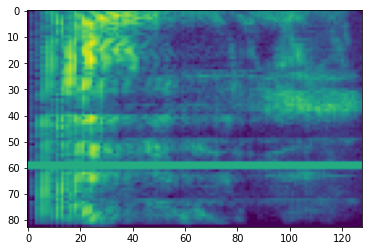
周波数マスキング
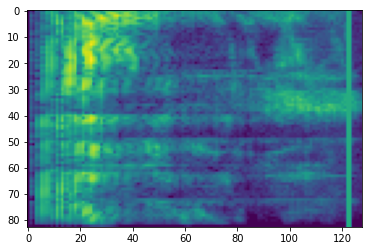
周波数マスキングでは、周波数チャンネルの [f0, f0 + f) がマスクされます。f は、0 から周波数マスクパラメータ F までの一様分布から選択され、f0 は、(0, ν − f) から選択されます。この ν は、周波数チャンネル数です。
# Freq masking
freq_mask = tfio.experimental.audio.freq_mask(dbscale_mel_spectrogram, param=10)

plt.figure()
plt.imshow(freq_mask.numpy())
<matplotlib.image.AxesImage at 0x7fe8cc30d9e8>
時間マスキング
時間マスキングでは、t 個の連続した時間ステップ [t0, t0 + t) がマスクされます。t は、0 から時間マスクパラメータ T までの一様分布から選択され、t0 は、[0, τ − t) から選択されます。この τ は時間ステップ数です。
# Time masking
time_mask = tfio.experimental.audio.time_mask(dbscale_mel_spectrogram, param=10)

plt.figure()
plt.imshow(time_mask.numpy())
<matplotlib.image.AxesImage at 0x7fe8cc277b38>
