 Xem trên TensorFlow.org Xem trên TensorFlow.org |  Chạy trong Google Colab Chạy trong Google Colab |  Xem trên GitHub Xem trên GitHub |  Tải xuống sổ ghi chép Tải xuống sổ ghi chép |  Xem mô hình TF Hub Xem mô hình TF Hub |
Máy tính xách tay này cho thấy làm thế nào để sử dụng CropNet sắn phân loại bệnh mô hình từ TensorFlow Hub. Các phân loại mô hình hình ảnh của lá sắn vào một trong 6 lớp: bạc lá vi khuẩn, bệnh sọc nâu, mite xanh, bệnh khảm, khỏe mạnh, hoặc chưa biết.
Chuyên mục này trình bày cách:
- Nạp https://tfhub.dev/google/cropnet/classifier/cassava_disease_V1/2 mô hình từ TensorFlow Hub
- Nạp sắn bộ dữ liệu từ TensorFlow Datasets (TFDS)
- Phân loại hình ảnh của lá sắn thành 4 loại bệnh hại sắn riêng biệt hoặc là khỏe mạnh hoặc không rõ.
- Đánh giá tính chính xác của phân loại và xem xét cách mạnh mẽ mô hình này là khi áp dụng cho ra những hình ảnh miền.
Nhập và thiết lập
pip install matplotlib==3.2.2
import numpy as np
import matplotlib.pyplot as plt

import tensorflow as tf
import tensorflow_datasets as tfds
import tensorflow_hub as hub
Chức năng trợ giúp để hiển thị các ví dụ
def plot(examples, predictions=None):
  # Get the images, labels, and optionally predictions
  images = examples['image']
  labels = examples['label']
  batch_size = len(images)
  if predictions is None:
    predictions = batch_size * [None]

  # Configure the layout of the grid
  x = np.ceil(np.sqrt(batch_size))
  y = np.ceil(batch_size / x)
  fig = plt.figure(figsize=(x * 6, y * 7))

  for i, (image, label, prediction) in enumerate(zip(images, labels, predictions)):
    # Render the image
    ax = fig.add_subplot(x, y, i+1)
    ax.imshow(image, aspect='auto')
    ax.grid(False)
    ax.set_xticks([])
    ax.set_yticks([])

    # Display the label and optionally prediction
    x_label = 'Label: ' + name_map[class_names[label]]
    if prediction is not None:
      x_label = 'Prediction: ' + name_map[class_names[prediction]] + '\n' + x_label
      ax.xaxis.label.set_color('green' if label == prediction else 'red')
    ax.set_xlabel(x_label)

  plt.show()
Dataset
Hãy tải các tập dữ liệu sắn từ TFDS
dataset, info = tfds.load('cassava', with_info=True)
Hãy xem thông tin tập dữ liệu để tìm hiểu thêm về nó, chẳng hạn như mô tả và trích dẫn và thông tin về số lượng ví dụ có sẵn
info
tfds.core.DatasetInfo(
    name='cassava',
    full_name='cassava/0.1.0',
    description="""
    Cassava consists of leaf images for the cassava plant depicting healthy and
    four (4) disease conditions; Cassava Mosaic Disease (CMD), Cassava Bacterial
    Blight (CBB), Cassava Greem Mite (CGM) and Cassava Brown Streak Disease (CBSD).
    Dataset consists of a total of 9430 labelled images.
    The 9430 labelled images are split into a training set (5656), a test set(1885)
    and a validation set (1889). The number of images per class are unbalanced with
    the two disease classes CMD and CBSD having 72% of the images.
    """,
    homepage='https://www.kaggle.com/c/cassava-disease/overview',
    data_path='gs://tensorflow-datasets/datasets/cassava/0.1.0',
    download_size=1.26 GiB,
    dataset_size=Unknown size,
    features=FeaturesDict({
        'image': Image(shape=(None, None, 3), dtype=tf.uint8),
        'image/filename': Text(shape=(), dtype=tf.string),
        'label': ClassLabel(shape=(), dtype=tf.int64, num_classes=5),
    }),
    supervised_keys=('image', 'label'),
    disable_shuffling=False,
    splits={
        'test': <SplitInfo num_examples=1885, num_shards=4>,
        'train': <SplitInfo num_examples=5656, num_shards=8>,
        'validation': <SplitInfo num_examples=1889, num_shards=4>,
    },
    citation="""@misc{mwebaze2019icassava,
        title={iCassava 2019Fine-Grained Visual Categorization Challenge},
        author={Ernest Mwebaze and Timnit Gebru and Andrea Frome and Solomon Nsumba and Jeremy Tusubira},
        year={2019},
        eprint={1908.02900},
        archivePrefix={arXiv},
        primaryClass={cs.CV}
    }""",
)
Bộ dữ liệu sắn có hình ảnh của lá sắn với 4 bệnh riêng biệt cũng như lá sắn khỏe mạnh. Mô hình có thể dự đoán tất cả các lớp này cũng như lớp thứ sáu cho "ẩn số" khi mô hình không tự tin vào dự đoán của nó.
# Extend the cassava dataset classes with 'unknown'
class_names = info.features['label'].names + ['unknown']

# Map the class names to human readable names
name_map = dict(
    cmd='Mosaic Disease',
    cbb='Bacterial Blight',
    cgm='Green Mite',
    cbsd='Brown Streak Disease',
    healthy='Healthy',
    unknown='Unknown')

print(len(class_names), 'classes:')
print(class_names)
print([name_map[name] for name in class_names])
6 classes:
['cbb', 'cbsd', 'cgm', 'cmd', 'healthy', 'unknown']
['Bacterial Blight', 'Brown Streak Disease', 'Green Mite', 'Mosaic Disease', 'Healthy', 'Unknown']
Trước khi có thể cung cấp dữ liệu vào mô hình, chúng ta cần thực hiện một chút tiền xử lý. Mô hình mong đợi hình ảnh 224 x 224 với giá trị kênh RGB trong [0, 1]. Hãy chuẩn hóa và thay đổi kích thước hình ảnh.
def preprocess_fn(data):
  image = data['image']

  # Normalize [0, 255] to [0, 1]
  image = tf.cast(image, tf.float32)
  image = image / 255.

  # Resize the images to 224 x 224
  image = tf.image.resize(image, (224, 224))

  data['image'] = image
  return data
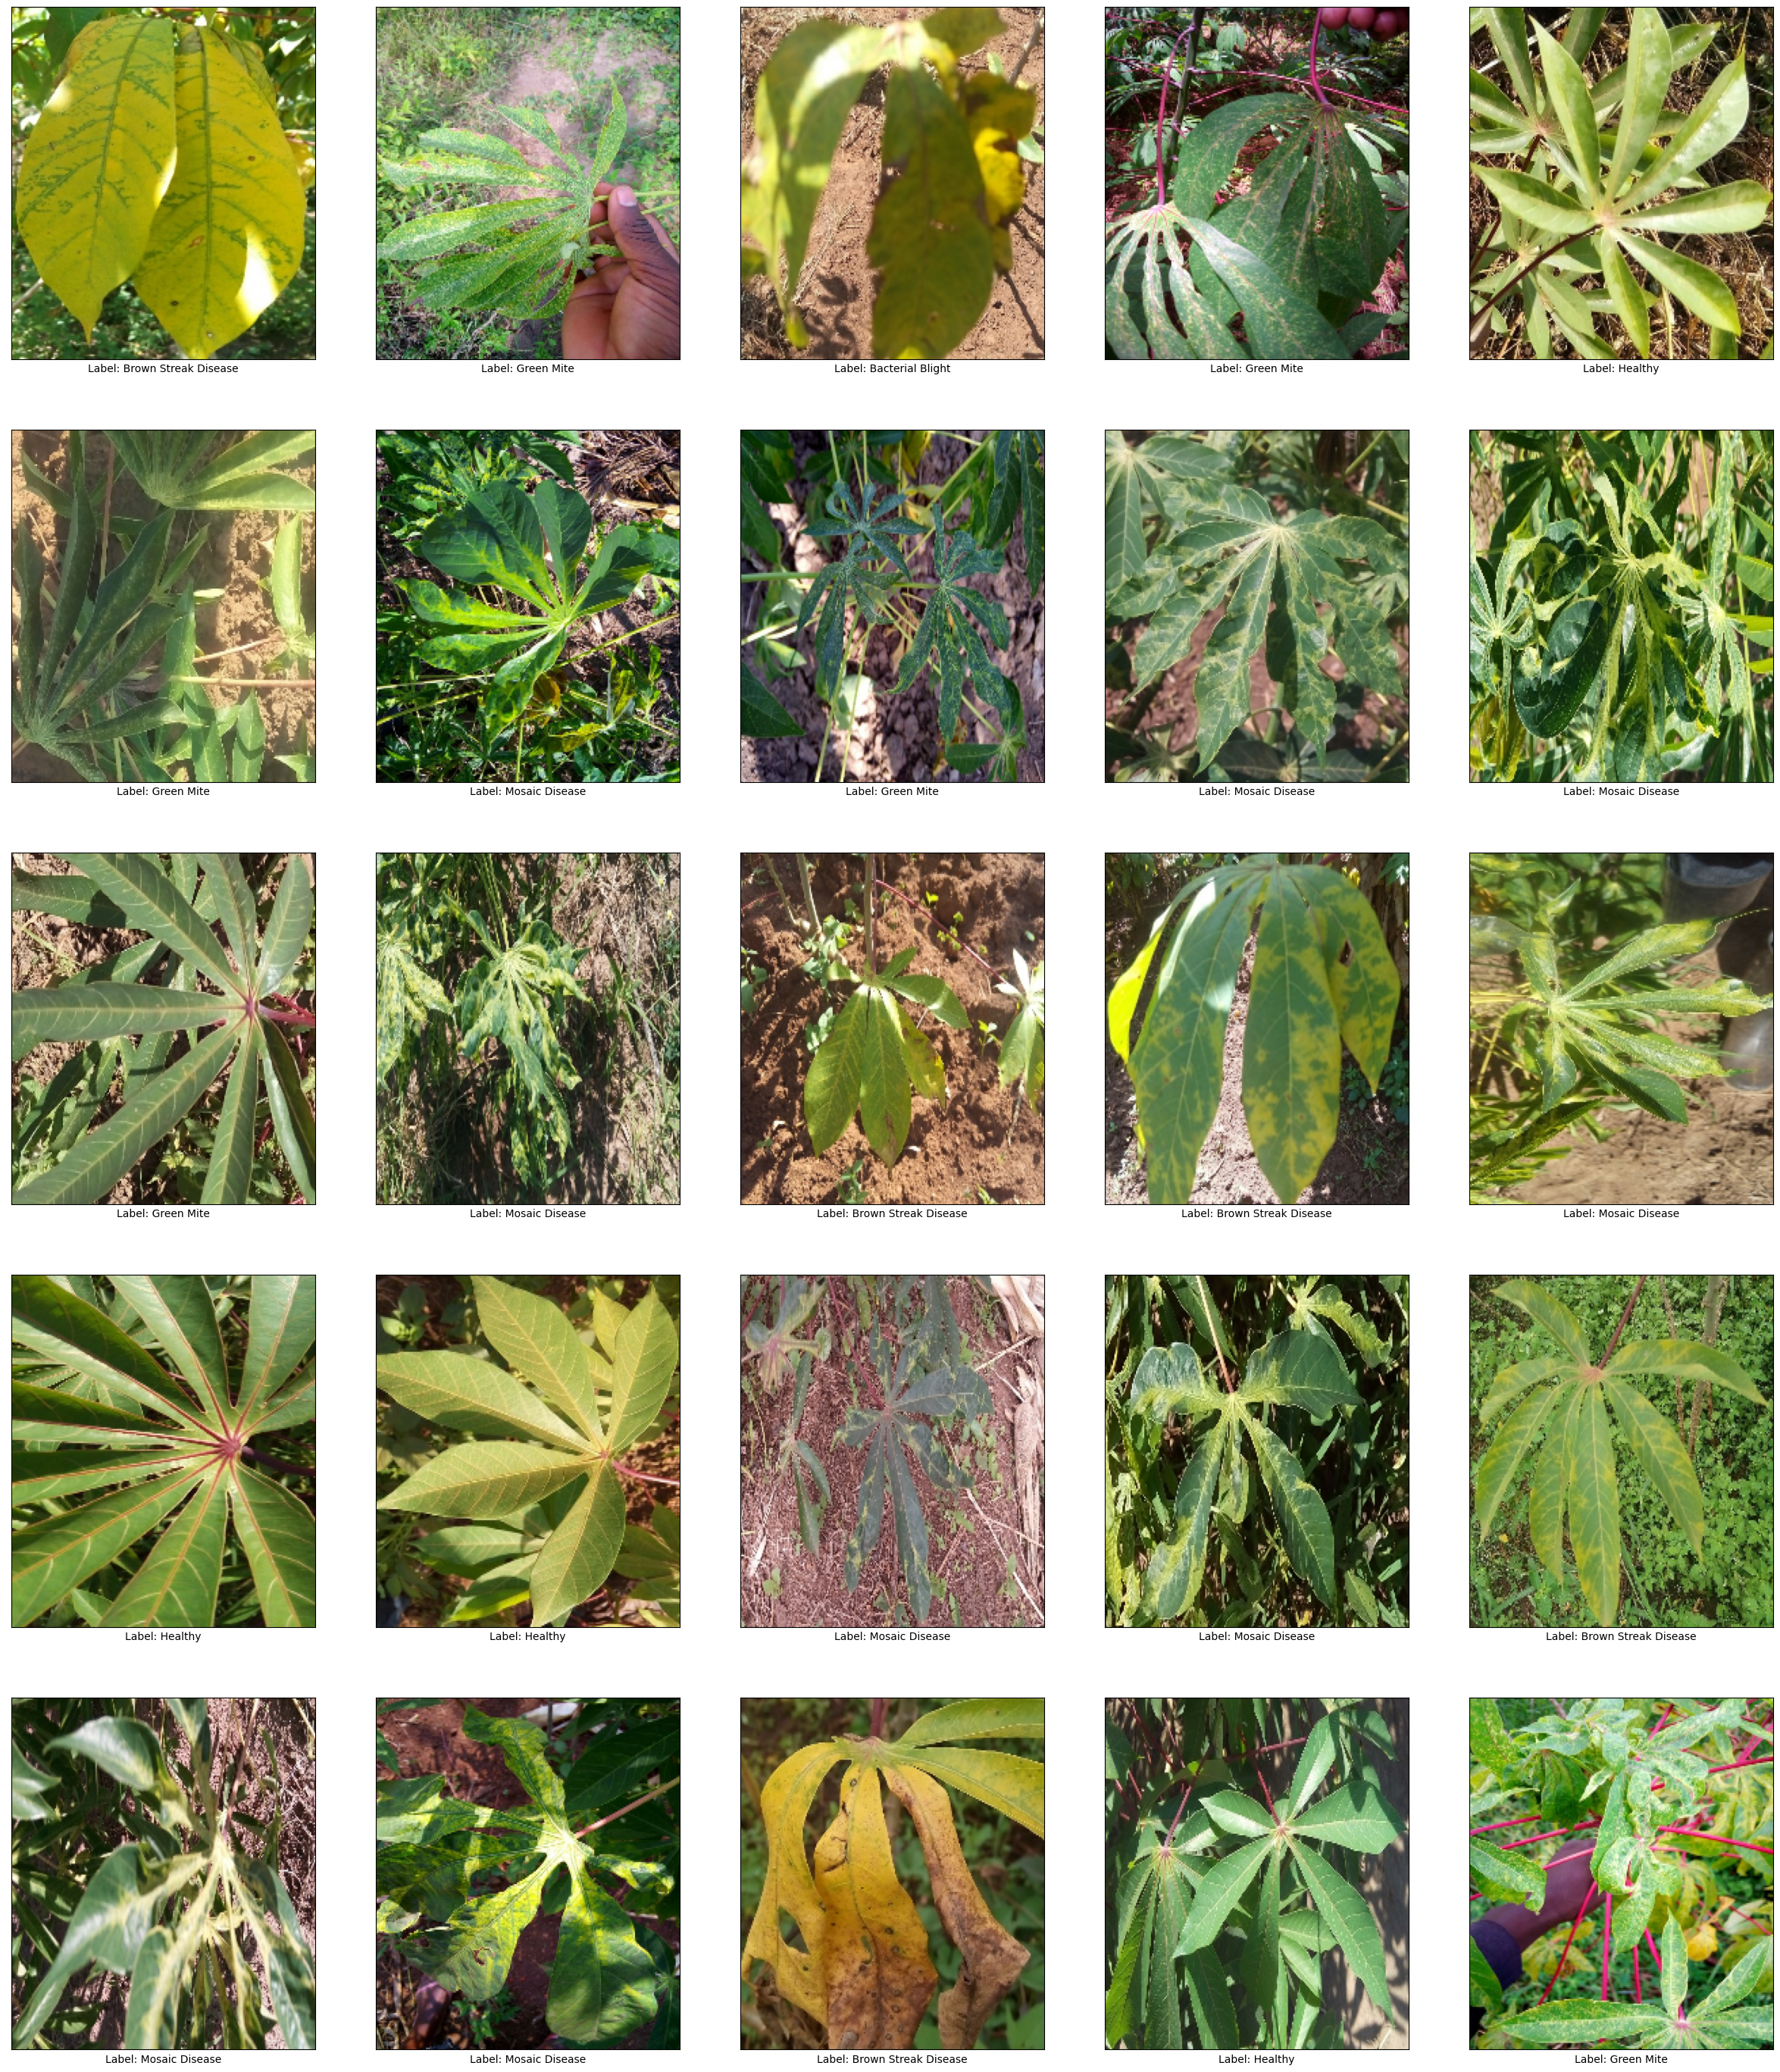
Hãy xem một vài ví dụ từ tập dữ liệu
batch = dataset['validation'].map(preprocess_fn).batch(25).as_numpy_iterator()
examples = next(batch)
plot(examples)

Mô hình
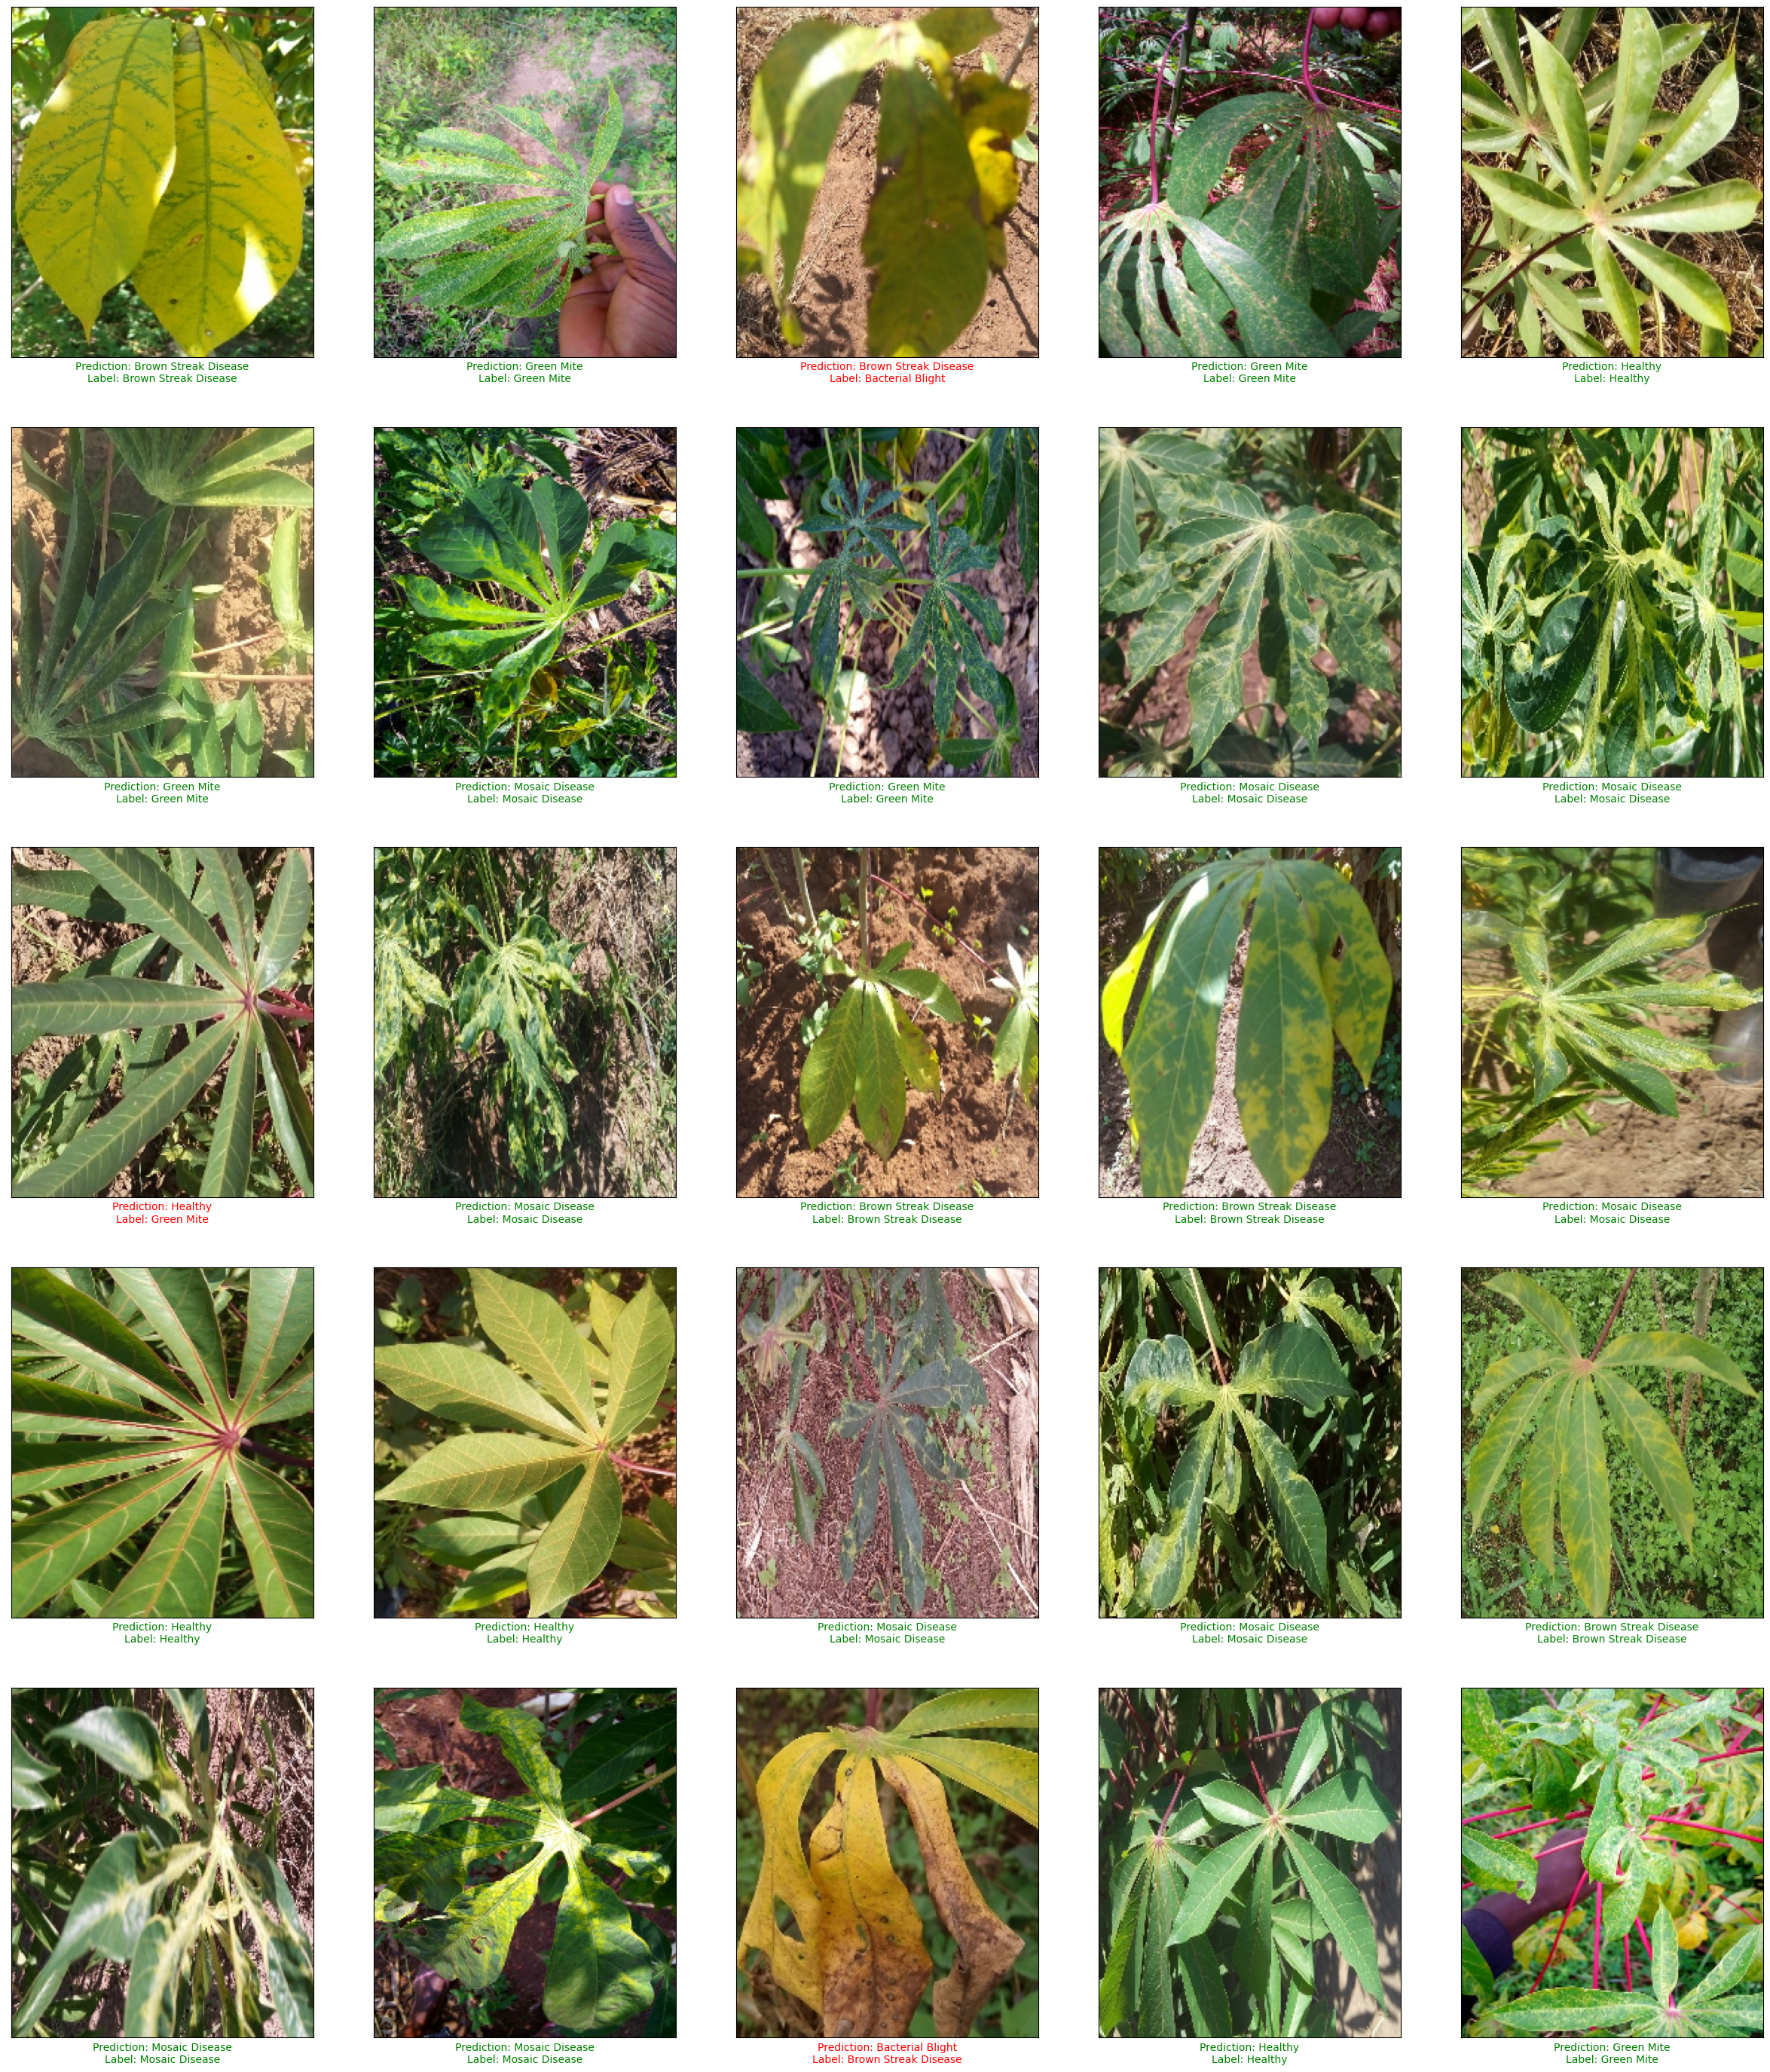
Hãy tải bộ phân loại từ TF Hub và nhận một số dự đoán và xem các dự đoán của mô hình là trên một số ví dụ
classifier = hub.KerasLayer('https://tfhub.dev/google/cropnet/classifier/cassava_disease_V1/2')
probabilities = classifier(examples['image'])
predictions = tf.argmax(probabilities, axis=-1)
plot(examples, predictions)

Đánh giá & độ mạnh
Hãy đo chính xác của phân loại của chúng tôi về một sự chia rẽ của tập dữ liệu. Chúng tôi cũng có thể nhìn vào sự vững mạnh của mô hình bằng cách đánh giá hiệu quả của nó trên một tập dữ liệu phi sắn. Đối với hình ảnh của bộ dữ liệu thực vật khác như iNaturalist hoặc đậu, các mô hình nên hầu như luôn luôn trở lại chưa biết.
Thông số
DATASET = 'cassava'
DATASET_SPLIT = 'test'
BATCH_SIZE =  32
MAX_EXAMPLES = 1000
def label_to_unknown_fn(data):
  data['label'] = 5  # Override label to unknown.
  return data
# Preprocess the examples and map the image label to unknown for non-cassava datasets.
ds = tfds.load(DATASET, split=DATASET_SPLIT).map(preprocess_fn).take(MAX_EXAMPLES)
dataset_description = DATASET
if DATASET != 'cassava':
  ds = ds.map(label_to_unknown_fn)
  dataset_description += ' (labels mapped to unknown)'
ds = ds.batch(BATCH_SIZE)

# Calculate the accuracy of the model
metric = tf.keras.metrics.Accuracy()
for examples in ds:
  probabilities = classifier(examples['image'])
  predictions = tf.math.argmax(probabilities, axis=-1)
  labels = examples['label']
  metric.update_state(labels, predictions)

print('Accuracy on %s: %.2f' % (dataset_description, metric.result().numpy()))
Accuracy on cassava: 0.88
Tìm hiểu thêm
- Tìm hiểu thêm về mô hình trên TensorFlow Hub: https://tfhub.dev/google/cropnet/classifier/cassava_disease_V1/2
- Tìm hiểu làm thế nào để xây dựng một hình ảnh tùy chỉnh phân loại chạy trên điện thoại di động với ML Kit với phiên bản TensorFlow Lite của mô hình này .
