 TensorFlow.org এ দেখুন TensorFlow.org এ দেখুন |  Google Colab-এ চালান Google Colab-এ চালান |  GitHub এ দেখুন GitHub এ দেখুন |  নোটবুক ডাউনলোড করুন নোটবুক ডাউনলোড করুন |  TF হাব মডেল দেখুন TF হাব মডেল দেখুন |
এই নোটবুক দেখায় কিভাবে CropNet ব্যবহার করতে কাসাভা রোগ ক্লাসিফায়ার TensorFlow হাব থেকে মডেল। ব্যাকটেরিয়া ব্লাইট, বাদামী কষ রোগ, সবুজ ফোঁটা, মোজাইক রোগ, সুস্থ, বা অজানা: 6 ক্লাস এক মধ্যে কাসাভা পাতার মডেল শ্রেণী চিত্রসমূহ।
এই কোল্যাব দেখায় কিভাবে:
- লোড https://tfhub.dev/google/cropnet/classifier/cassava_disease_V1/2 TensorFlow হাব থেকে মডেল
- লোড কাসাভা TensorFlow ডেটাসেটস থেকে ডেটা সেটটি (TFDS)
- কাসাভা পাতার ছবিকে 4টি স্বতন্ত্র কাসাভা রোগের বিভাগে বা সুস্থ বা অজানা হিসাবে শ্রেণীবদ্ধ করুন।
- কিভাবে শক্তসমর্থ মডেল যখন ডোমেইন ইমেজ আউট প্রয়োগ করা হয় এ ক্লাসিফায়ার এবং চেহারা নির্ভুলতা নির্ণয় করা।
আমদানি এবং সেটআপ
pip install matplotlib==3.2.2
import numpy as np
import matplotlib.pyplot as plt

import tensorflow as tf
import tensorflow_datasets as tfds
import tensorflow_hub as hub
উদাহরণ প্রদর্শনের জন্য সহায়ক ফাংশন
def plot(examples, predictions=None):
  # Get the images, labels, and optionally predictions
  images = examples['image']
  labels = examples['label']
  batch_size = len(images)
  if predictions is None:
    predictions = batch_size * [None]

  # Configure the layout of the grid
  x = np.ceil(np.sqrt(batch_size))
  y = np.ceil(batch_size / x)
  fig = plt.figure(figsize=(x * 6, y * 7))

  for i, (image, label, prediction) in enumerate(zip(images, labels, predictions)):
    # Render the image
    ax = fig.add_subplot(x, y, i+1)
    ax.imshow(image, aspect='auto')
    ax.grid(False)
    ax.set_xticks([])
    ax.set_yticks([])

    # Display the label and optionally prediction
    x_label = 'Label: ' + name_map[class_names[label]]
    if prediction is not None:
      x_label = 'Prediction: ' + name_map[class_names[prediction]] + '\n' + x_label
      ax.xaxis.label.set_color('green' if label == prediction else 'red')
    ax.set_xlabel(x_label)

  plt.show()
ডেটাসেট
আসুন লোড TFDS থেকে কাসাভা ডেটা সেটটি
dataset, info = tfds.load('cassava', with_info=True)
এর সম্পর্কে আরও জানতে ডেটাসেটের তথ্য দেখে নেওয়া যাক, যেমন বিবরণ এবং উদ্ধৃতি এবং কতগুলি উদাহরণ পাওয়া যায় সে সম্পর্কে তথ্য
info
tfds.core.DatasetInfo(
    name='cassava',
    full_name='cassava/0.1.0',
    description="""
    Cassava consists of leaf images for the cassava plant depicting healthy and
    four (4) disease conditions; Cassava Mosaic Disease (CMD), Cassava Bacterial
    Blight (CBB), Cassava Greem Mite (CGM) and Cassava Brown Streak Disease (CBSD).
    Dataset consists of a total of 9430 labelled images.
    The 9430 labelled images are split into a training set (5656), a test set(1885)
    and a validation set (1889). The number of images per class are unbalanced with
    the two disease classes CMD and CBSD having 72% of the images.
    """,
    homepage='https://www.kaggle.com/c/cassava-disease/overview',
    data_path='gs://tensorflow-datasets/datasets/cassava/0.1.0',
    download_size=1.26 GiB,
    dataset_size=Unknown size,
    features=FeaturesDict({
        'image': Image(shape=(None, None, 3), dtype=tf.uint8),
        'image/filename': Text(shape=(), dtype=tf.string),
        'label': ClassLabel(shape=(), dtype=tf.int64, num_classes=5),
    }),
    supervised_keys=('image', 'label'),
    disable_shuffling=False,
    splits={
        'test': <SplitInfo num_examples=1885, num_shards=4>,
        'train': <SplitInfo num_examples=5656, num_shards=8>,
        'validation': <SplitInfo num_examples=1889, num_shards=4>,
    },
    citation="""@misc{mwebaze2019icassava,
        title={iCassava 2019Fine-Grained Visual Categorization Challenge},
        author={Ernest Mwebaze and Timnit Gebru and Andrea Frome and Solomon Nsumba and Jeremy Tusubira},
        year={2019},
        eprint={1908.02900},
        archivePrefix={arXiv},
        primaryClass={cs.CV}
    }""",
)
কাসাভা ডেটা সেটটি 4 স্বতন্ত্র রোগে আক্রান্ত কাসাভা পাতার সেইসাথে সুস্থ কাসাভা পাতার ছবি নেই। মডেলটি এই সমস্ত ক্লাসের পাশাপাশি "অজানা" এর জন্য ষষ্ঠ শ্রেণীর ভবিষ্যদ্বাণী করতে পারে যখন মডেলটি তার ভবিষ্যদ্বাণীতে আত্মবিশ্বাসী হয় না।
# Extend the cassava dataset classes with 'unknown'
class_names = info.features['label'].names + ['unknown']

# Map the class names to human readable names
name_map = dict(
    cmd='Mosaic Disease',
    cbb='Bacterial Blight',
    cgm='Green Mite',
    cbsd='Brown Streak Disease',
    healthy='Healthy',
    unknown='Unknown')

print(len(class_names), 'classes:')
print(class_names)
print([name_map[name] for name in class_names])
6 classes:
['cbb', 'cbsd', 'cgm', 'cmd', 'healthy', 'unknown']
['Bacterial Blight', 'Brown Streak Disease', 'Green Mite', 'Mosaic Disease', 'Healthy', 'Unknown']
আমরা মডেলে ডেটা ফিড করার আগে, আমাদের কিছুটা প্রিপ্রসেসিং করতে হবে। মডেলটি [0, 1]-এ RGB চ্যানেল মান সহ 224 x 224 চিত্র আশা করে। এর ইমেজ স্বাভাবিক এবং রিসাইজ করা যাক.
def preprocess_fn(data):
  image = data['image']

  # Normalize [0, 255] to [0, 1]
  image = tf.cast(image, tf.float32)
  image = image / 255.

  # Resize the images to 224 x 224
  image = tf.image.resize(image, (224, 224))

  data['image'] = image
  return data
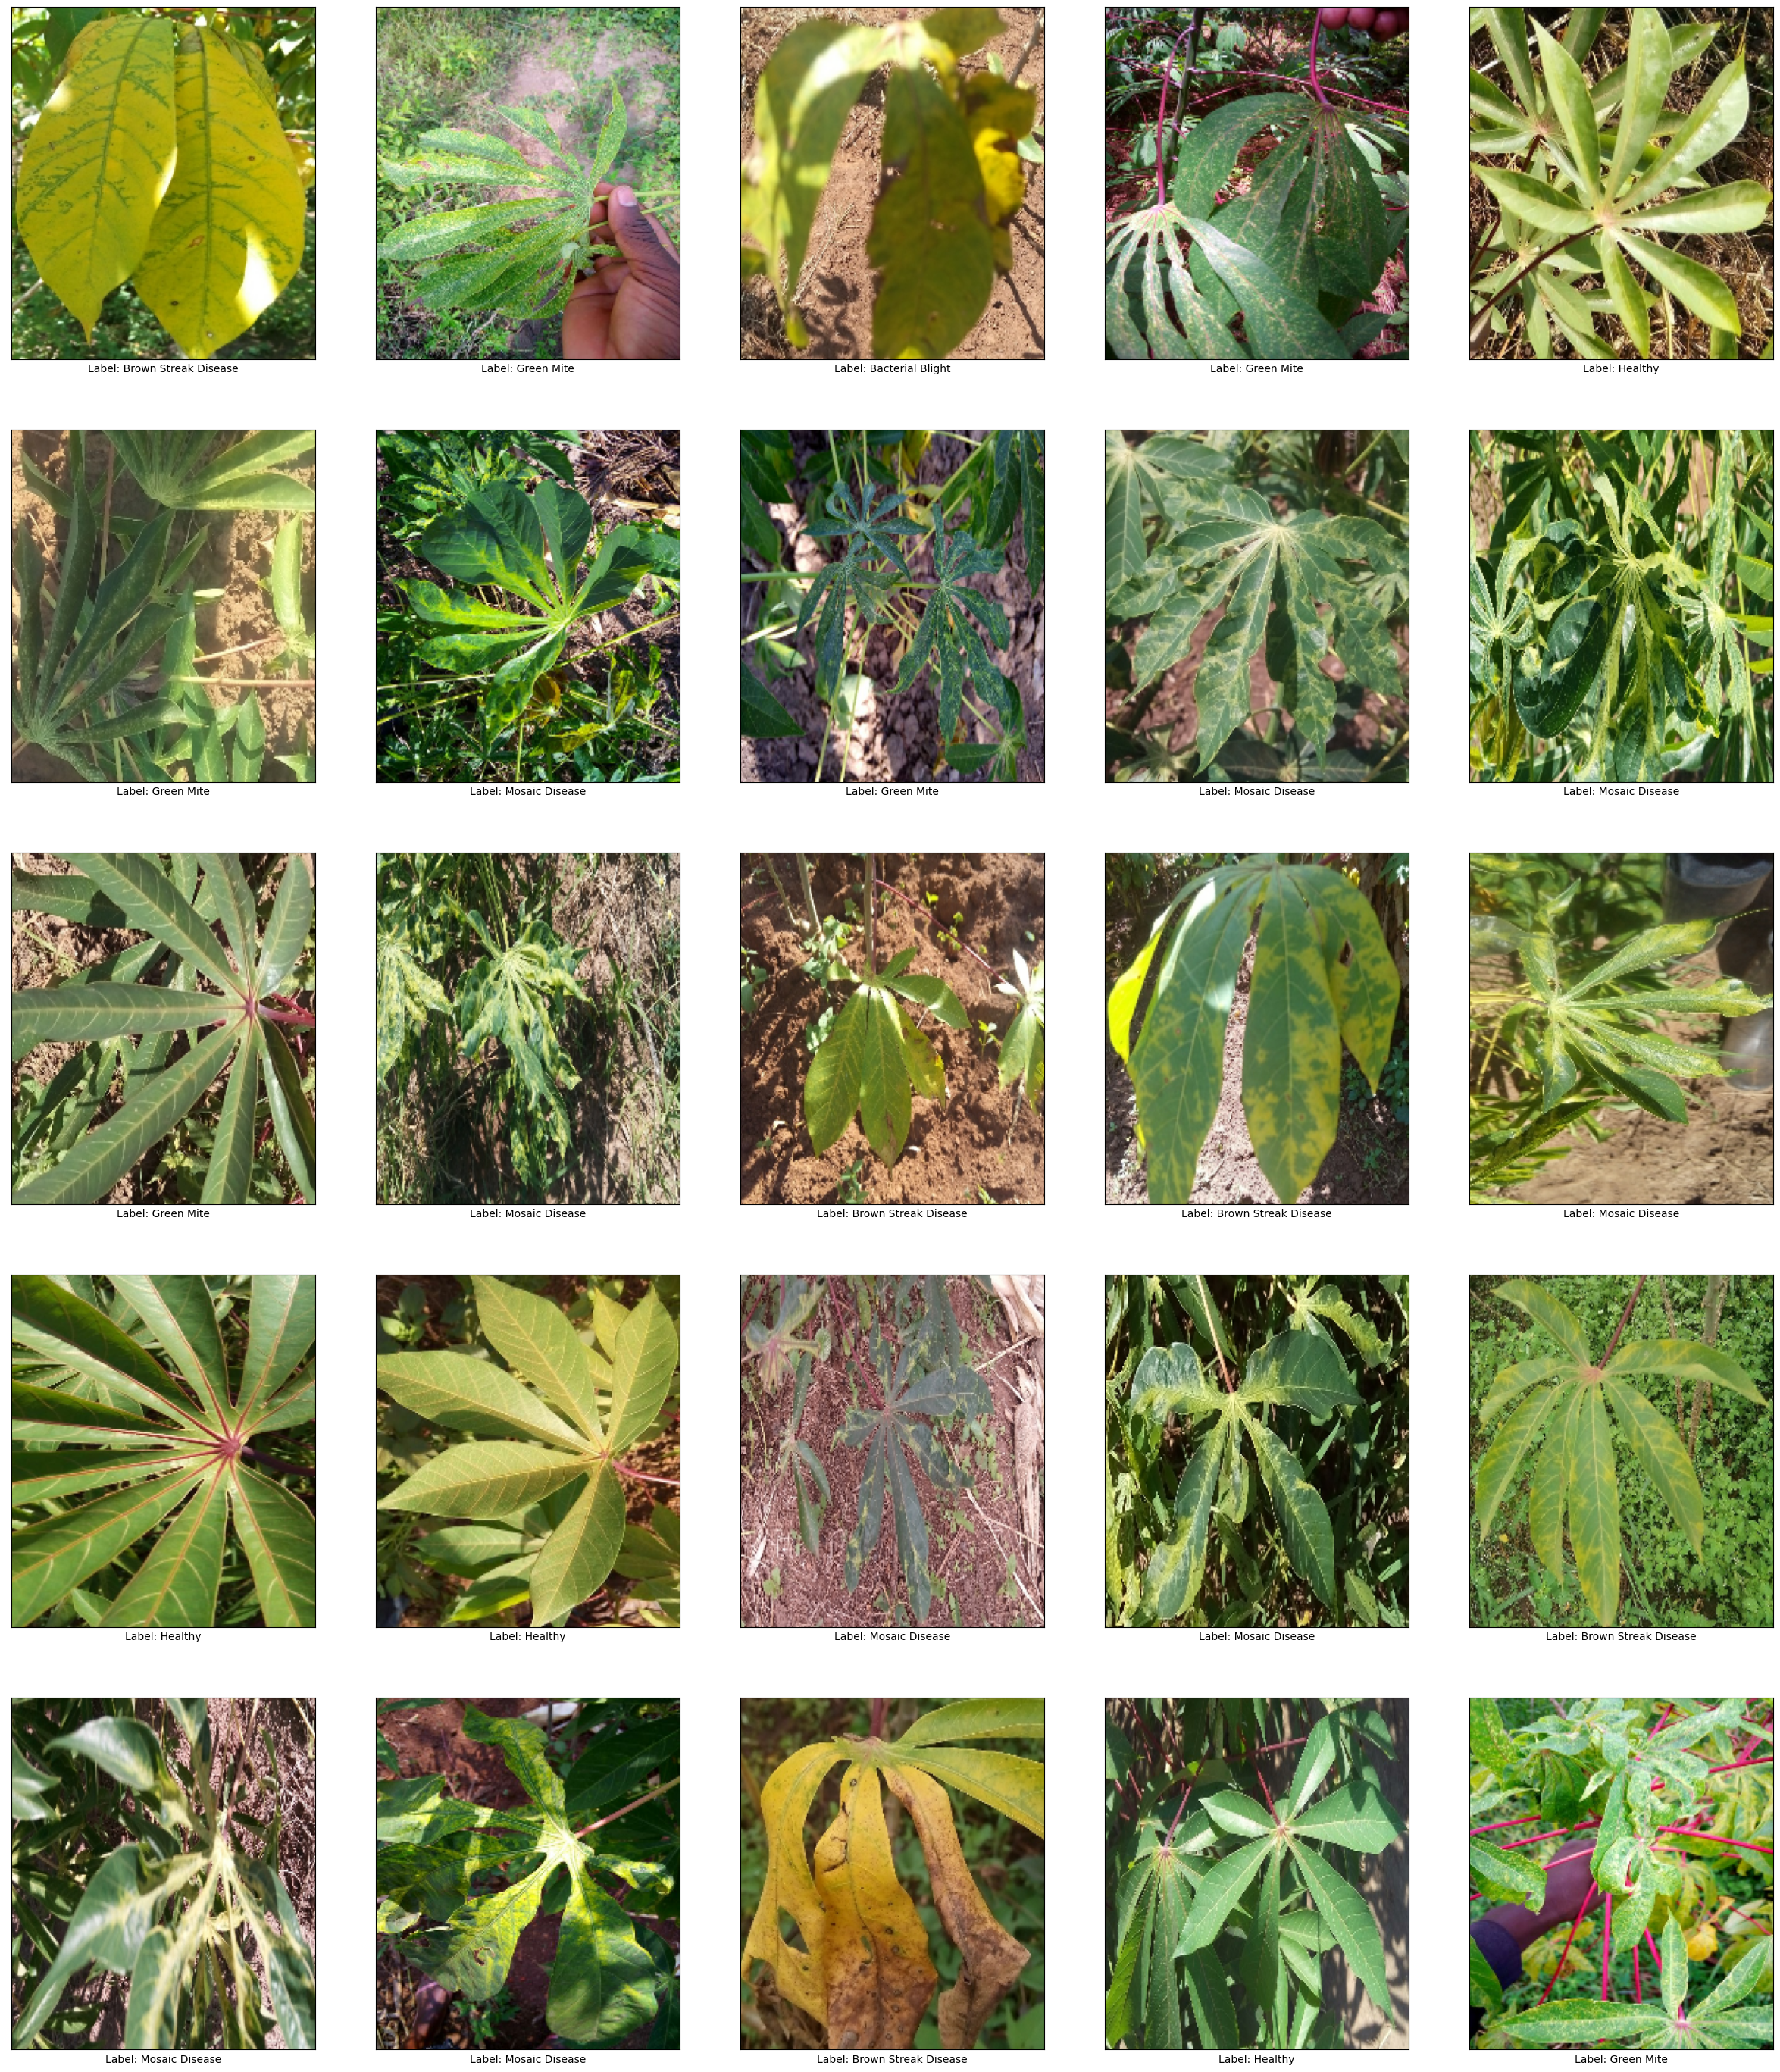
আসুন ডেটাসেট থেকে কয়েকটি উদাহরণ দেখে নেওয়া যাক
batch = dataset['validation'].map(preprocess_fn).batch(25).as_numpy_iterator()
examples = next(batch)
plot(examples)

মডেল
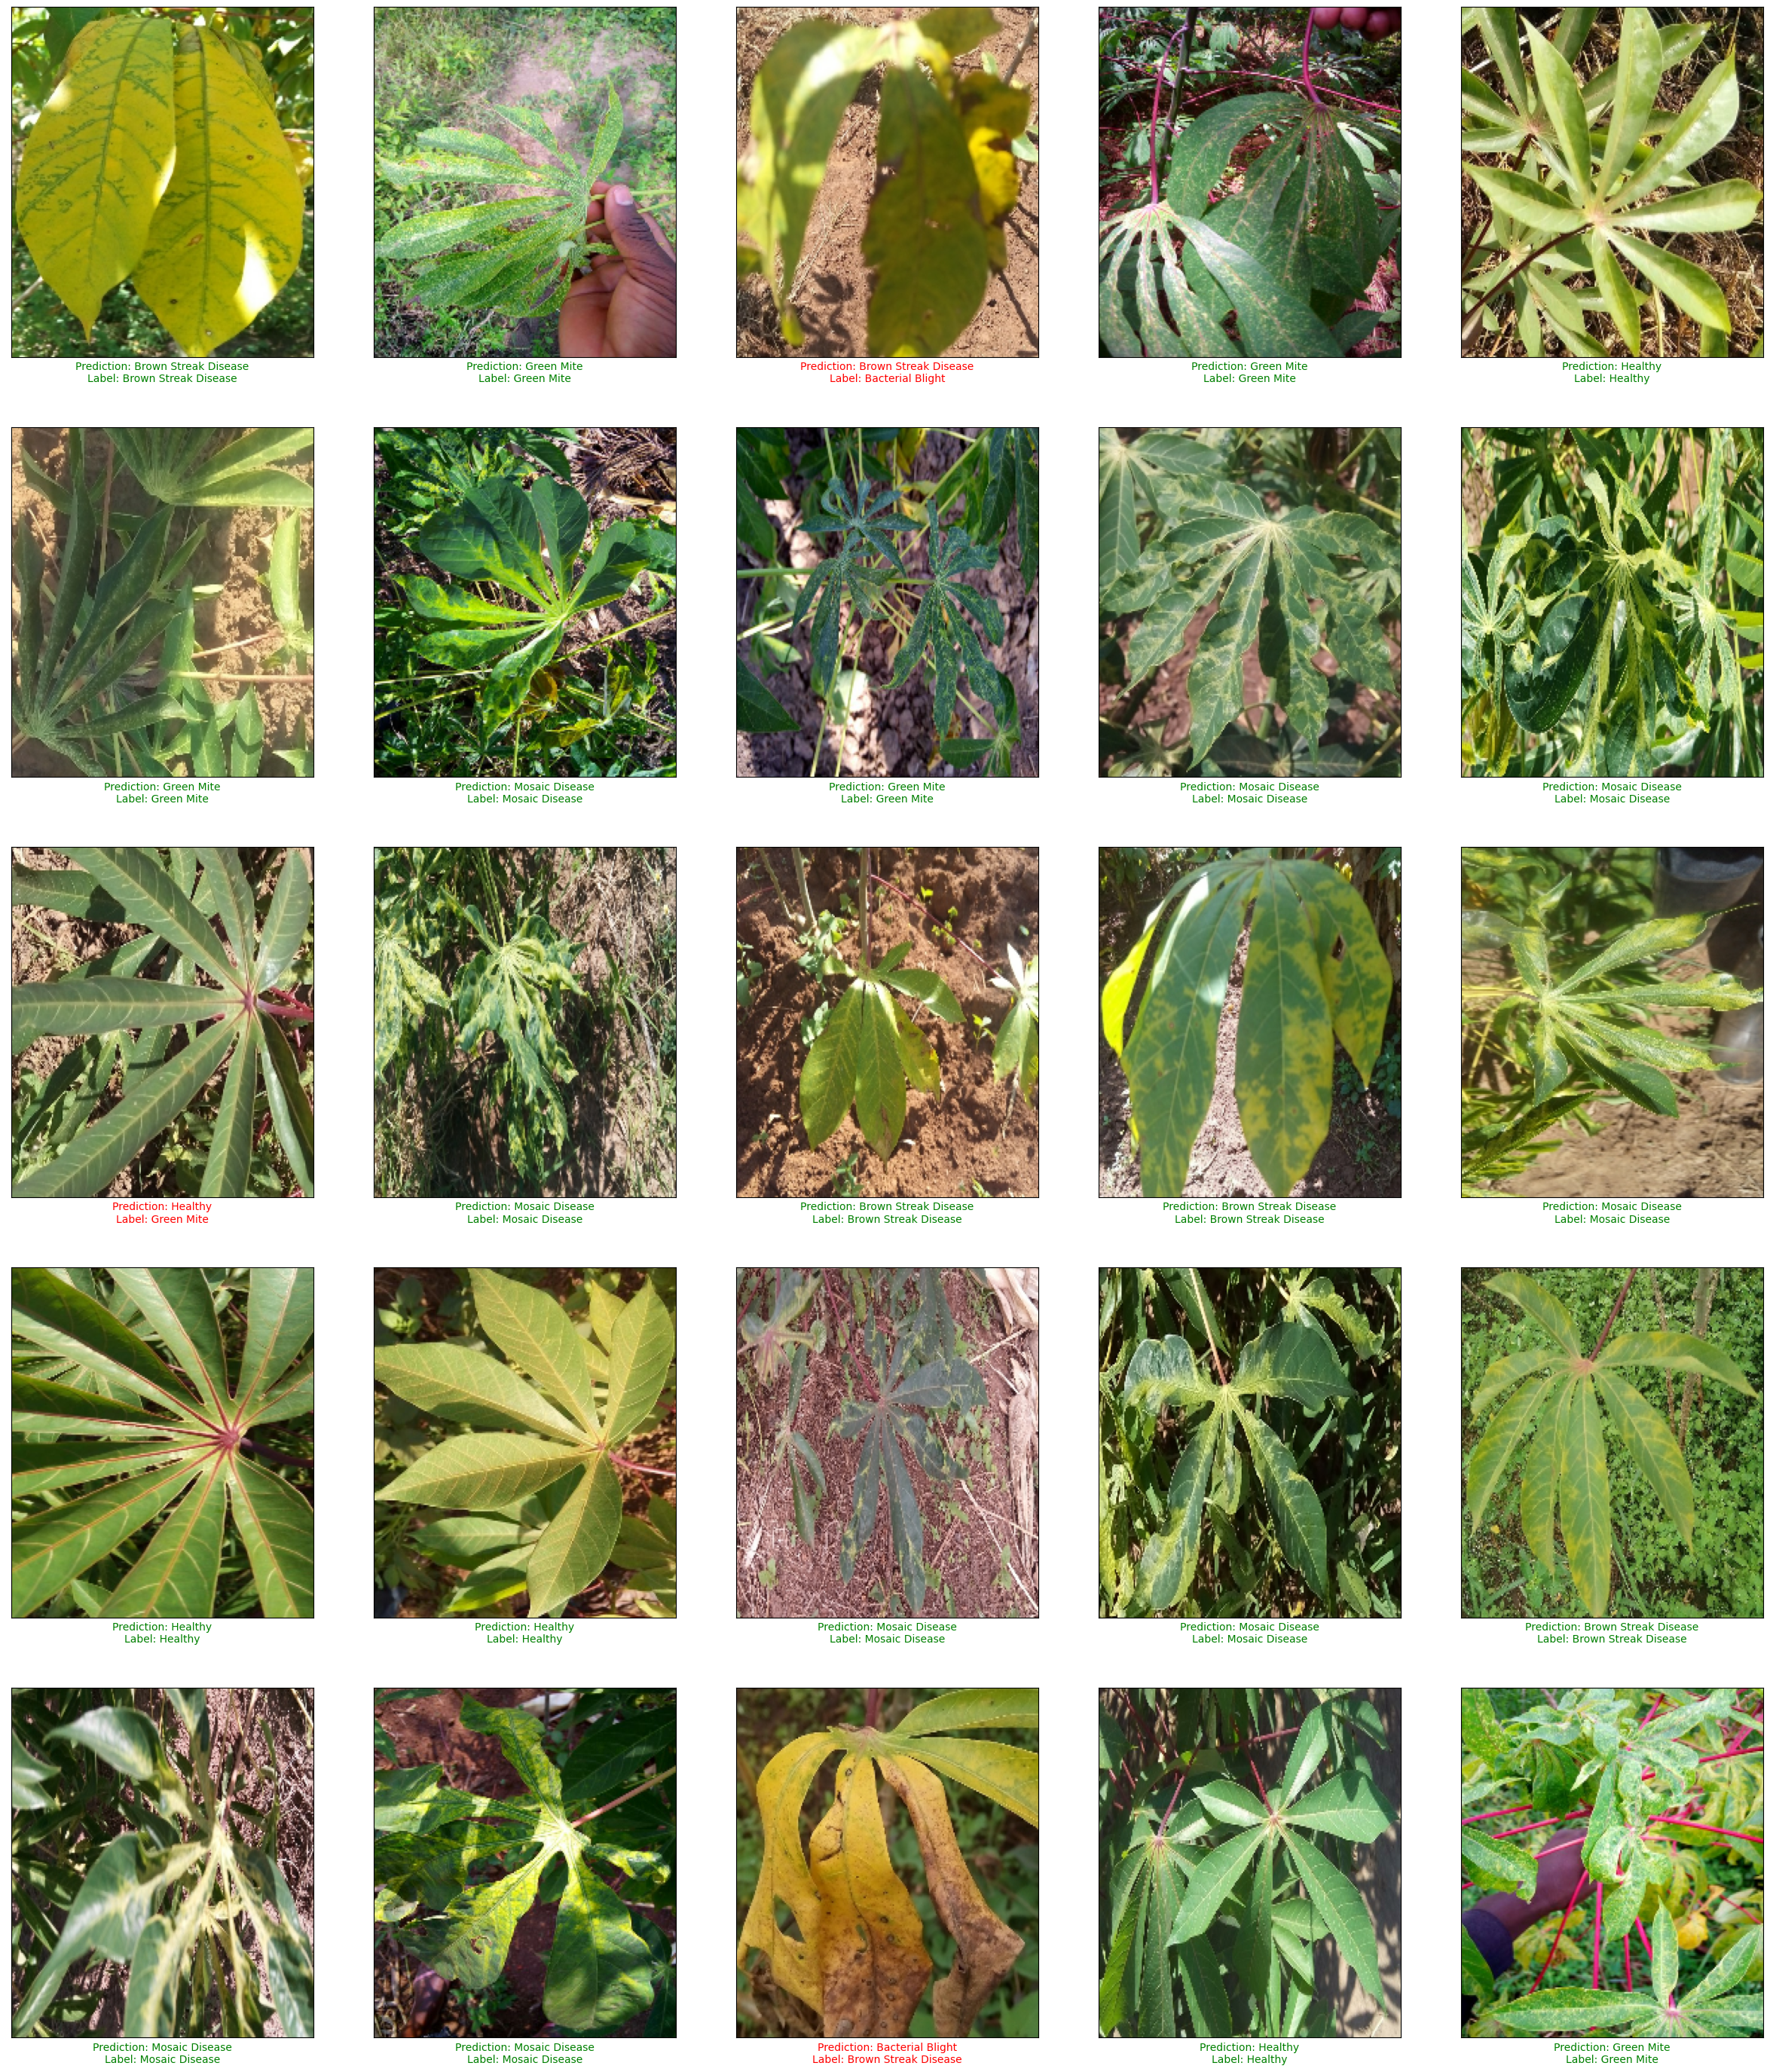
আসুন TF হাব থেকে ক্লাসিফায়ার লোড করি এবং কিছু ভবিষ্যদ্বাণী করি এবং দেখুন মডেলের ভবিষ্যদ্বাণী কয়েকটি উদাহরণে রয়েছে
classifier = hub.KerasLayer('https://tfhub.dev/google/cropnet/classifier/cassava_disease_V1/2')
probabilities = classifier(examples['image'])
predictions = tf.argmax(probabilities, axis=-1)
plot(examples, predictions)

মূল্যায়ন এবং দৃঢ়তা
এর ডেটাসেটের একটি বিভক্ত আমাদের ক্লাসিফায়ার নির্ভুলতা পরিমাপ করা যাক। আমরা একটি অ-কাসাভা ডেটা সেটটি তার কর্মক্ষমতা মূল্যায়ন দ্বারা মডেলের বলিষ্ঠতার তাকান করতে পারেন। INaturalist বা মটরশুটি মত অন্যান্য উদ্ভিদ ডেটাসেট ছবি জন্য, মডেল প্রায় সবসময় অজানা ফেরত পাঠাবেন।
পরামিতি
DATASET = 'cassava'
DATASET_SPLIT = 'test'
BATCH_SIZE =  32
MAX_EXAMPLES = 1000
def label_to_unknown_fn(data):
  data['label'] = 5  # Override label to unknown.
  return data
# Preprocess the examples and map the image label to unknown for non-cassava datasets.
ds = tfds.load(DATASET, split=DATASET_SPLIT).map(preprocess_fn).take(MAX_EXAMPLES)
dataset_description = DATASET
if DATASET != 'cassava':
  ds = ds.map(label_to_unknown_fn)
  dataset_description += ' (labels mapped to unknown)'
ds = ds.batch(BATCH_SIZE)

# Calculate the accuracy of the model
metric = tf.keras.metrics.Accuracy()
for examples in ds:
  probabilities = classifier(examples['image'])
  predictions = tf.math.argmax(probabilities, axis=-1)
  labels = examples['label']
  metric.update_state(labels, predictions)

print('Accuracy on %s: %.2f' % (dataset_description, metric.result().numpy()))
Accuracy on cassava: 0.88
আরও জানুন
- TensorFlow হাব উপর মডেল সম্পর্কে আরো জানুন: https://tfhub.dev/google/cropnet/classifier/cassava_disease_V1/2
- কিভাবে সঙ্গে একটি মোবাইল ফোনে একটি কাস্টম চিত্র ক্লাসিফায়ার চলমান করা যায় তা শিখুন এমএল কিট সঙ্গে এই মডেলের TensorFlow লাইট সংস্করণের ।
